")
Back to Journals » Neuropsychiatric Disease and Treatment » Volume 20
Ensemble Learning for Higher Diagnostic Precision in Schizophrenia Using Peripheral Blood Gene Expression Profile
Authors Wagh VV , Kottat T , Agrawal S, Purohit S , Pachpor TA, Narlikar L , Paralikar V , Khare SP
Received 9 November 2023
Accepted for publication 12 March 2024
Published 3 May 2024 Volume 2024:20 Pages 923—936
DOI https://doi.org/10.2147/NDT.S449135
Checked for plagiarism Yes
Review by Single anonymous peer review
Peer reviewer comments 2
Editor who approved publication: Dr Roger Pinder
Vipul Vilas Wagh,1 Tanvi Kottat,1 Suchita Agrawal,2 Shruti Purohit,2 Tejaswini Arun Pachpor,3,4 Leelavati Narlikar,5 Vasudeo Paralikar,2 Satyajeet Pramod Khare1
1Symbiosis School of Biological Sciences, Symbiosis International (Deemed University), Pune, MH, India; 2Psychiatry Unit, KEM Hospital Research Centre, Pune, MH, India; 3Department of Biosciences and Technology, School of Science and Environment Studies, Dr. Vishwanath Karad MIT World Peace University, Pune, MH, India; 4Department of Biotechnology, MES Abasaheb Garware College, Pune, MH, India; 5Department of Data Science, Indian Institute of Science Education and Research, Pune, MH, India
Correspondence: Vasudeo Paralikar; Satyajeet Pramod Khare, Email [email protected]; [email protected]
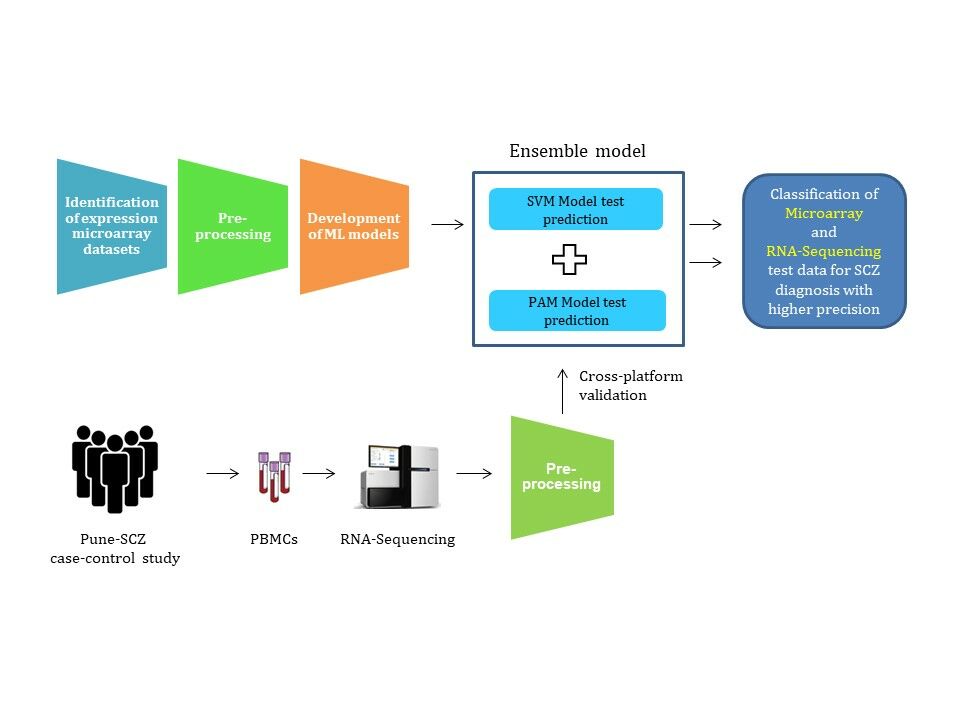
Introduction: Stigma contributes to a significant part of the burden of schizophrenia (SCZ), therefore reducing false positives from the diagnosis would be liberating for the individuals with SCZ and desirable for the clinicians. The stigmatization associated with schizophrenia advocates the need for high-precision diagnosis. In this study, we present an ensemble learning-based approach for high-precision diagnosis of SCZ using peripheral blood gene expression profiles.
Methodology: The machine learning (ML) models, support vector machines (SVM), and prediction analysis for microarrays (PAM) were developed using differentially expressed genes (DEGs) as features. The SCZ samples were classified based on a voting ensemble classifier of SVM and PAM. Further, microarray-based learning was used to classify RNA sequencing (RNA-Seq) samples from our case-control study (Pune-SCZ) to assess cross-platform compatibility.
Results: Ensemble learning using ML models resulted in a significantly higher precision of 80.41% (SD: 0.04) when compared to the individual models (SVM-radial: 71.69%, SD: 0.04 and PAM 77.20%, SD: 0.02). The RNA sequencing samples from our case-control study (Pune-SCZ) resulted in a moderate precision (59.92%, SD: 0.05). The feature genes used for model building were enriched for biological processes such as response to stress, regulation of the immune system, and metabolism of organic nitrogen compounds. The network analysis identified RBX1, CUL4B, DDB1, PRPF19, and COPS4 as hub genes.
Conclusion: In summary, this study developed robust models for higher diagnostic precision in psychiatric disorders. Future efforts will be directed towards multi-omic integration and developing “explainable” diagnostic models.
Keywords: Schizophrenia, peripheral blood, gene expression, machine learning, ensemble learning
Graphical Abstract:
Introduction
Schizophrenia (SCZ) is a complex neuropsychiatric disorder characterized by a disruption in thinking and sense of self. The death rate is two times higher in schizophrenia-affected individuals, with cardiovascular diseases and suicide as the leading causes of death.1–3 The global burden of disease 2019 estimates that almost 24 million people are affected by SCZ globally, which indicates its universal presence irrespective of cultural differences worldwide.4 Significant issues in treating psychiatric disorders are delayed diagnosis and limited certainty of the diagnosis itself. The current diagnostic procedure for SCZ is based on psychiatric evaluation, making it clinician-dependent. The Diagnostic and Statistical Manual of Mental Disorders (DSM-5) based diagnosis for SCZ requires symptoms to be persistent for six months or more.5 The delay in the treatment accounts for a higher number of years lived with disability associated with SCZ.6 Recent studies suggest that treatment outcomes can be improved if the time elapsed before the treatment is reduced.7 Thus, having a sensitive and specific blood test can strengthen and hasten the current diagnostic process for SCZ.
Cellular alterations, such as gene expression changes associated with the disorder, have been proposed to be useful as potential biomarkers. A previous study provides substantial evidence for using peripheral blood gene expression profiles for biomarker discovery.8 The recent use of machine learning (ML) tools has accelerated the biomarker discovery process for psychiatric disorders.9–11 ML models employ statistical methods to learn from the data to achieve specific objectives. Support vector machines (SVM) and nearest shrunken centroids (NSC) are popular examples of supervised learning ML algorithms used in genomics, particularly in transcriptomics.12
The ML tools have already provided gene expression markers with higher diagnostic potential.9,10,13 Currently, the ML-based in silico approaches are limited to publicly available microarray datasets. ML-based in silico studies using biomarkers have reported higher diagnostic performance for psychiatric disorders.10,11,14,15 However, few studies have validated their ML models using independent datasets.9,13,16 Moreover, we found no studies addressing potential data leakage from preprocessing steps like quantile normalization and feature selection in transcriptomic data. Application of the diagnostic models into clinics would need extensive validation and appropriate data scaling methods to develop models with real-world applications. In addition, most of the studies focused on accuracy and area under the receiver operating characteristic curve (AUROC) as evaluation parameters for the performance of ML models. However, SCZ is associated with a higher degree of stigmatization.17,18 The stigmatization, especially in developing countries, can lead to unwarranted distress in the lives of those falsely diagnosed with SCZ.19,20 Thus, a disorder like SCZ demands a higher precision diagnostic test [True positives / (True positives + False positives)] with minimal false positives.
This study employs SVM and PAM for the binary classification of SCZ samples. SVM excels in managing high-dimensional and non-linear datasets commonly encountered in transcriptomics. It achieves this by effectively identifying optimal decision boundaries between the closest data points (support vectors) to separate different classes.21 PAM is a modified version of NSC tailored explicitly for transcriptomic data. It accurately captures gene expression patterns (centroids) associated with each class and classifies new samples by assessing their similarity to those of the class centroids.22 We have ensembled SVM and PAM to combine their strengths and enhance the discriminative power for high-precision classification in SCZ.
We selected publicly available gene expression microarray datasets for this analysis. The raw data from each platform was processed independently to avoid data leakage. ML models were developed using SVM and PAM algorithms. We made use of differential gene expression analysis (DGEA) for selecting features with potential diagnostic values. The analysis pipeline used in this study does not result in data leakage, producing ML models more likely to succeed in clinical settings. Further, the ensemble of two ML models classifies samples from test and independent microarray datasets with higher precision. This study also highlights the importance of preprocessing RNA sequencing (RNA-Seq) data for its compatibility with prediction analysis. Our approach is not restricted to microarray data: it classifies RNA-Seq samples from our case-control study (Pune-SCZ) with moderate precision. Finally, gene ontology analysis of differentially expressed genes (DEGs) highlights the biological processes associated with SCZ, further validating our approach. Subsequent network analysis of these feature genes opens avenues for discovering novel diagnostic biomarkers for SCZ.
Materials and Methods
Identification of Datasets
Peripheral blood gene expression microarray datasets for SCZ were identified from the Gene Expression Omnibus (GEO)23 and ArrayExpress24 using keywords, “Gene expression”, “Peripheral blood”, “Biomarkers” and “Schizophrenia” or “Schizophrenia spectrum”. A similar search was performed on databases such as PubMed and Google Scholar. Studies with immortalized cell lines, specific cell types, and custom microarray platforms were excluded. The analysis included studies with available raw data, while the authors of studies without publicly available data were contacted to obtain the data necessary for the analysis.
Importing and Preprocessing of the Raw Data
Raw data for each dataset was imported and processed independently in R.25 Probe filtration was performed for Illumina datasets (eg Illumina probes with detection P.val <0.05 in ≥ 3 samples were retained). Probe IDs of all the arrays were mapped to HUGO Gene Nomenclature Committee (HGNC) gene symbols.26 Gene expression values for multiple probes were averaged out for individual genes, and common genes across all the datasets were retained. Of the datasets identified, one was set aside for independent dataset validation. The remaining datasets were combined to obtain a meta-file. This meta-file with raw gene expression values (raw meta-file) was processed for ML-based prediction analysis.
Data Scaling for Machine Learning
The raw meta-file (raw gene expression matrix) was divided into train and test data before normalization and batch correction to avoid any data leakage. To achieve this, samples were shuffled and then subjected to a random selection of train (90%) and test (10%) data. This random selection was repeated to obtain ten iterations of train and test datasets. Samples within the training data were quantile normalized based on the microarray platform. Training data was further batch-corrected independently. In contrast, test data was normalized using quantile targets27 from train data and batch corrected using train data as a reference.28 Each iteration of normalized and batch-corrected train data was used for feature selection and development of ML models. In contrast, test data was used to evaluate ML models. Similarly, the independent dataset was normalized and batch-corrected using each iteration of the train data as a reference and further used for evaluation of the models (Figure 1).
 |
Figure 1 The workflow depicts the steps involved in sample processing and class prediction analysis. A raw meta-file with common genes (rows) across microarray datasets and samples (columns) was used for the analysis. Samples from the raw meta-file were shuffled and subjected to a random selection of train and test data (9:1) generating ten iterations each. Each iteration of train data was independently quantile normalized. The preprocessed train data was used for feature selection and model training. Normalization and batch correction for test data, independent dataset, and RNA-Seq data were performed using train data as a reference. The performance of the individual models was compared with the ensemble learning. The models were also evaluated for their cross-platform compatibility using RNA-Seq samples. |
Feature Selection and Development of ML Models
We used differential gene expression analysis (DGEA) as a feature selection method. Differentially expressed genes (SCZ vs healthy controls, CNT) were identified using limma.29 The top differentially expressed genes were used as features for model building. We used SVM30 with different kernels (linear, polynomial, radial, and sigmoid) and PAM31, both with a probability threshold of 0.5, for binary classification. Each iteration of train data was used for the development of ML models. These models were tuned and cross-validated (k=10) to asses over-fitting. The performance of the machine learning models was assessed using respective test data generated from the random sampling. In addition, the model’s prediction ability was further validated using an independent dataset. The ML models were evaluated based on their prediction accuracy, sensitivity, specificity, precision, and AUROC of test data and independent dataset. Further, ML models were ensembled for higher precision (Figure 1).
Ensemble Learning and Evaluation
To improve the precision of class prediction, we ensembled SVM and PAM models (Figure 1). In brief, only samples predicted as cases by both ML algorithms were labelled as cases in ensemble learning. The performance of the ensemble learning was evaluated in comparison with individual models using parameters such as precision, accuracy, sensitivity, specificity, and AUROC. Of the ten iterations, the one with the highest precision in ensemble learning was further used for functional enrichment analysis.
Functional Enrichment and Network Analysis
Functional enrichment analysis of the genes of interest was carried out using g:Profiler.32 Search tool for the retrieval of interacting genes/proteins (STRING)33 based protein-protein interaction (PPI) network for these genes was established in Cytoscape.34 The essential nodes (hub genes) of the PPI network were identified by the maximal clique centrality (MCC) method of the cytoHubba plugin.35 A network of hub genes and their first-stage nodes were later visualized in Cytoscape.
Establishment of Case-Control Study
This study complies with the Declaration of Helsinki. Protocol for the Pune-SCZ study was approved by the KEM Hospital Research Centre Ethics Committee (KEMHRC ID No. 2001) and Symbiosis International (Deemed University) Independent Ethics Committee (SIU/IEC/99). We recruited 20 participants of the age group 18–65 years from the Psychiatry Unit KEM Hospital, Pune. A written informed consent was obtained from all the participants before recruitment. For participants affected by SCZ, written informed consent from a spouse or first-degree relative aged 18 or above was obtained, regardless of the affected participant’s capacity to consent. The exclusion criteria for healthy control (CNT) and schizophrenia (SCZ) groups were the presence of a) acute or chronic infections, b) coronary heart disease, c) metabolic disorders, d) arrhythmia, e) heart disorders, f) hyper and hypothyroidism, g) inflammatory bowel disease and h) multiple sclerosis. Female participants with polycystic ovary syndrome, pregnant and lactating mothers, and women on in-vitro fertilization (IVF) treatment at the time of recruitment were also excluded from the study. The participants with a suspected case of schizophrenia and schizophrenia spectrum disorder were considered for recruitment under the SCZ group. Age and sex-matched participants with no history of psychiatric disorders were considered for recruitment under the healthy control group. All the participants were screened to confirm or refute the diagnosis of schizophrenia using structured clinical interview for the DSM-5 research version (SCID-5-RV).
Recruitment of Participants and Clinical Assessment
SCZ diagnosis was made using SCID-5-RV (version 1.0.0).36 The SCID-5-RV was administered by a trained psychiatrist and a psychologist. The SCZ diagnosis was later confirmed by a senior psychiatrist from the team. SCZ-diagnosed participants were also administered with positive and negative syndrome scale (PANSS).37 The presence of SCZ and other psychiatric disorders, including past history, was ruled out in the control group participants. Age, sex, family history for psychiatric disorders, medical history, and medication status were recorded for all the participants.
Blood Collection and RNA Extraction
Random (non-fasting) venous blood samples were collected in dipotassium ethylenediaminetetraacetic acid (K2EDTA) vacutainers and processed on the same recruitment day. A blood cell count (hemogram) was performed on the samples collected. Peripheral blood mononuclear cells (PBMCs) were isolated using Ficoll-Paque (Sigma, Catalogue: GE17-5442-02) density gradient centrifugation and re-suspended in TRIZOL (ThermoFischer Scientific, Catalogue: 15596026). Samples were subjected to RNA sequencing using commercial services. In brief, polyA enriched RNA samples were sequenced using the NovaSeq 6000 system - Illumina to obtain a minimum of 60 million paired-end reads of 150 nucleotide length.
Preprocessing of RNA Sequencing Data
The quality of each sample was confirmed using FastQC.38 The sequences were aligned to the human genome (GENECODE hg38)39 using HISAT2.40 The aligned files were subjected to gene assignment using featureCounts41 to create a count matrix. The gene expression values were locally normalized by converting the raw count to counts per million (CPM) and transcript per million (TPM). The raw counts (RC), CPM, and TPM matrices were further quantile normalized and batch corrected in reference to microarray training datasets independently. The quantile normalized and batch-corrected RC, CPM, and TPM matrices were further used to evaluate the cross-platform performance of ML models developed using microarray data.
Statistical Analysis
Data from processed microarray datasets and samples from the Pune-SCZ study were analyzed using Microsoft Excel- Real Statistics42 and PAST.43 Microarray datasets processed using PAM, SVM, and ensemble approach were tested for normality using the Shapiro–Wilk test. For data with normal distribution, a paired version of one-way ANOVA, repeated measures ANOVA (RMA), with an alpha of 0.05, was performed. Following this, Tukey’s post hoc test was applied with Greenhouse-Geisser and Huynh-Feldt corrections. The AUROC was plotted using ROCR.44 For clinical samples, age and blood cell count data were tested for normality, as mentioned previously. The difference between case and control groups was studied using an unpaired t-test for normal data and a Mann–Whitney U-test for non-normal data. A chi-square test was conducted to assess the variations in categorical variables, such as sex, between the groups.
Results
Comparative Performance of the ML Models in Test and Independent Dataset
We identified seven peripheral blood expression array datasets for SCZ (Table 1). Participants from these datasets belonged to different ethnic groups. Most of the datasets identified had medicated or a mixed population of SCZ participants. For Kumarasinghe et al paired study, only the “before treatment” samples were considered for the analysis to avoid the over-representation of the same samples. Of the seven datasets identified, GSE27383 was placed aside as an independent dataset. Only the genes common to the other six datasets were retained for the analysis. The resulting metafile with 377 samples and 6858 genes was used for class prediction analysis. The preprocessing of the test data and independent dataset (GSE27383) resulted in normalized (Supplementary Figures 1 and 2) and batch-corrected (Supplementary Figure 3) data. The DGEA of each train data iteration resulted in the identification of differentially expressed genes (DEGs) as features (Supplementary Figure 4). ML models were built using these feature genes from training datasets.
 |
Table 1 Peripheral Blood Gene Expression Microarray Datasets for Schizophrenia |
We used two different ML models, SVM and PAM, for prediction analysis. SVM models with kernels such as “linear”, “polynomial”, “radial”, and “sigmoid” did not show any significant difference in the test data prediction accuracy. We, therefore chose the more popular SVM-radial for further analysis. The trained SVM-radial and PAM models were used to classify the test data samples (generated from random sampling) and an independent dataset (GSE27383). The performance of SVM-radial and PAM was evaluated based on the mean test data prediction accuracy, sensitivity, specificity, precision, and AUROC. We did not observe any significant difference in the model performance for the test and independent dataset sample classification (Supplementary Figure 5). The results discussed below are from the independent dataset. In contrast, the results from test data have been included as Supplementary Material.
The Number of Features Affects the Performance of SVM but Not PAM
A comparison of SVM-radial models with different numbers of feature genes (top5, top25, top100, top400, top1600, and all genes) revealed that its performance increases with the number of DEGs (Table 2). However, the different number of feature genes did not affect the performance of the PAM models (Table 2). We did not observe any significant difference in the performance of either of the ML models with 400 DEGs and above (Table 2). The performance of the SVM-radial and PAM with 400 DEGs was visualized using receiver operating characteristic curve analysis (Figure 2A and B). A similar performance of the models was observed in the prediction of test data samples (Supplementary Table 1). To further improve the precision, SVM-radial and PAM models were used for combinatorial analysis.
 |
Table 2 Performance of SVM-Radial and PAM Models in Independent Dataset Class Prediction Analysis |
 |
Figure 2 Receiver operating characteristic (ROC) curves for ML models in the independent dataset prediction analysis. (A) The AUROC for SVM-radial with 400 DEGs was found to be 75.54%. (B) Similarly, an AUC of 77.79% was observed for PAM models. The ROC curves of iteration one was used as representative images. Note: The blue marker denotes the probability cut-off of 0.5. |
Ensemble Learning Results in Higher Precision for Schizophrenia Diagnosis
Selected ML models of SVM-radial and PAM were used for the combinatorial analysis. In brief, only the samples identified as cases by both algorithms were classified as cases to reduce false positives in prediction analysis. Ensemble learning of models with a hundred and more feature genes resulted in significantly higher precision and accuracy than those with fewer DEGs. The performance of ensemble learning did not significantly differ in test data and the independent dataset (data not shown).
In the independent dataset, the highest precision of 84.55% (SD: 0.04) was observed for ensemble-all genes with an accuracy of 66.39% (SD: 0.02). Also, we did not observe a significant difference in sensitivity and specificity of ensemble-400, ensemble-1600, and ensemble-all genes (data not shown). We chose ensemble-400 for further analysis. The precision of ensemble-400 (80.41%, SD: 0.04) was significantly higher than the individual models of SVM-radial (71.69%, SD:0.04) and PAM (77.20%, SD: 0.02) without any significant drop in accuracy (Figure 3A and B).
 |
Figure 3 Performance of ensemble learning in the independent microarray dataset and RNA-Seq samples class prediction analysis. SVM-radial, PAM, and their ensemble with 400 DEGs were compared using RMA followed by Tukey’s post hoc test with Greenhouse-Geisser and Huynh-Feldt corrections (adjusted P value <0.05). (A) Ensemble learning classified samples from the independent microarray dataset with significantly higher precision compared to individual models. (B) The high precision was obtained without any significant drop in accuracy. Similarly, the cross-platform performance of ensemble learning was tested using RNA-Seq samples from the Pune-SCZ study. (C and D) Ensemble learning classified RNA-Seq samples with high precision and without a significant drop in accuracy when compared to the individual models. Note: Error bars represent standard deviation for ten iterations, “**” (adjusted P value ≤ 0.01), “****” (adjusted P value ≤ 0.0001), “ns” (adjusted P value > 0.05). |
Microarray-Based ML Models Classified RNA-Seq Samples with Moderate Precision
A case-control study (Pune-SCZ) was established with 20 participants of Indian origin (SCZ: 10, CNT: 10). There was no significant difference in age, sex, and blood cell counts between case and control group participants (Supplementary Table 2). All the SCZ-affected participants recruited in this study were on antipsychotic medication. RNA was isolated from the peripheral blood samples of the participants and subjected to RNA-Seq analysis. The sequencing resulted in ~80 million reads per sample. The quality of sequencing was satisfactory (Supplementary Figure 6), which resulted in an acceptable percentage of alignment (Supplementary Table 3). The RNA-Seq data was used for external cross-platform validation of the models. The class prediction analysis was performed using raw counts (RC), counts per million (CPM), and transcript per million (TPM) matrices, as mentioned in the methodology section. The prediction accuracy of ML models with TPM counts was relatively better compared to CPM and RC. The performance of ML models with TPM counts is reported in this analysis. The ensemble-400 was able to classify SCZ samples with moderate precision (59.92%, SD: 0.05), which was significantly higher than the SVM-radial (52.20%, SD: 0.07) (Figure 3C). However, SVM-radial (52.00%, SD: 0.07), PAM (59.50%, SD: 0.02), and ensemble with top 400 DEGs (58.00%, SD: 0.03) predicted RNA-Seq test samples with low accuracy (Figure 3D). The higher precision of ensemble models was accompanied by higher specificity and lower sensitivity compared to the individual models (Supplementary Figure 7).
Functional Enrichment and Network Analysis Identified Biological Processes and Hub Genes Associated with Schizophrenia
The ensemble learning with the top 400 differentially expressed genes (DEGs) predicted SCZ samples in the independent dataset with higher precision (Figure 3A). Since the independent dataset mimics the clinical settings, the top 400 DEGs from its best iteration of the ensemble- 400 (iteration one) were chosen for functional enrichment analysis. The enrichment analysis of the 400 DEGs identified organonitrogen compound metabolic process, response to stress, and cellular response to the stimulus as the top three biological processes (adjusted P value < 0.05). Among the enriched processes, the biological processes related to immune function appeared more frequently, followed by processes related to protein metabolism (Supplementary Figure 8A). We identified the top five hub genes (RBX1, CUL4B, DDB1, PRPF19, and COPS4) from the PPI network of the top 400 DEGs from iteration one of the training data (Supplementary Figure 8B).
Discussion
Neuropsychiatric disorders such as schizophrenia are associated with stigmatization. Hence, diagnostic tests with high precision are needed. In this study, we developed an ensemble learning model with higher precision for classifying SCZ samples. We developed a unique strategy of preprocessing microarray data to build a robust model that can be used to analyze a single sample. We used the feature selection approach (DGEA) for better “explainability” in clinical settings12 and SVM and PAM for binary classification analysis. The two algorithms use different logic for classification, and a consensus rule resulted in higher precision without any significant drop in accuracy compared to the individual models (Figure 3A and B). The increase in precision was associated with increased specificity and an expected but moderate decline in sensitivity (Supplementary Figure 9A and 9B).
We could identify a limited number of studies that have used ML models for classification analysis in SCZ using peripheral blood gene expression data. Most of these studies have focused on validation of the previously reported DEGs.10,51–53 Zhu et al reported AUROC of 0.993 for SVM using previously reported DEGs in brain samples.10 Tsuang et al (n=30) and Middleton et al (n=33) used DEGs from their cohort to classify SCZ and bipolar disorder with an accuracy of 95–97%.54,55 Several merged data-analyses of publicly available microarray datasets have also been performed to address the confounding effects of different ethnicities. Zhang et al, in their study, achieved a remarkable classification accuracy of 100% with locally weighted learning (LWL).56 The study highlighted the use of a correlation-based feature selection algorithm for SCZ class prediction analysis. Similarly, Jonathan Hess et al reported an AUROC of 0.72 to 0.77 for SCZ vs CNT and 0.607 for bipolar disorder vs SCZ in two separate studies with independent datasets.9,16
We did not come across a study with the aim of developing ML models with higher precision. In this regard, we ensembled predictions of the best performing models of SVM-radial (Precision: 71.69% SD: 0.04) and PAM (Precision: 77.20%, SD: 0.02) with 400 DEGs for high precision. The ensemble learning resulted in higher precision (80.41%; SD: 0.04) without a significant drop in accuracy (Figure 3A and B). The models’ performance remained consistent despite biological variations such as drug status and technical differences in the datasets, indicating its robustness, especially for clinical applications (Supplementary Figure 10). Previous studies have suggested a need to integrate biological and clinical information for better performance of ML models.11,43 However, the unavailability of clinical information for each sample in the publicly available GEO datasets restricted our analysis to only gene expression markers.
We tested the cross-platform performance of ensemble learning with 400 DEGs using RNA-Seq data from the Pune-SCZ study. Similar to the independent microarray dataset (GSE27383), these samples were not part of the ML model development and hence served as independent data for validation of the models. We established a case-control study with age and sex-matched participants (Pune-SCZ). The validation datasets included TPM, CPM, and RC values generated from the RNA-Sequencing results. The prediction accuracy of test data with TPM values was expected to be higher compared to CPM and RC since the TPM values are not influenced by gene length. Similar to microarray data, ensemble learning using TPM resulted in significantly better precision as compared to individual models (Figure 3C). PAM models performed significantly better when compared to the support vector machines (SVM-radial); however, the overall low accuracies of individual models suggest a need for the development of better cross-platform normalization techniques (Figure 3D).
The 400 DEGs from the best-performing iteration of ensemble learning were chosen for functional enrichment analysis. The enrichment analysis identified organonitrogen compound metabolic process (GO: 1,901,564) as one of the enriched biological processes. These results are in accordance with the previous report.57 The other top biological processes, such as response to stress (GO:0006950) and its child-term cellular response to stimulus (GO:0051716), have not been directly reported in association with schizophrenia before. However, the response to oxidative stress (GO:0006979), a child term of response to stress, has been implicated in the pathogenesis of psychiatric disorders.58,59 In addition to this, other biological processes related to immune function and cell cycle regulation have also been associated with SCZ earlier (Supplementary Figure 8A).60–62
We also identified the key regulators (hub genes) of the protein-protein interaction network (Supplementary Figure 8B). The hub genes identified in this study have been previously reported in association with neuropsychiatric disorders, including SCZ. The genome-wide association studies have also associated RBX1, DDB1, PRPF19, and COPS4 with SCZ.63,64 Further, RBX1, CUL4B, DDB1, PRPF19, and COPS4 are known to be differentially expressed in the brain of SCZ-affected individuals.65 Of the hub genes identified, only RBX1 and CUL4B have been reported to be differentially expressed in the peripheral blood.66,67 Interestingly, Sun L et al reported upregulation of CUL4B in drug naïve and first-onset schizophrenia participants.67 Of the 400 DEGs SIGIRR, SRPK1, TIPARP, RPRD1A, TGFA, IL18BP, POLR3H, NKG7, GOT2, MAP4K1, C11orf1, MCM3, CUL4B, CTBP1, NELFCD, MAGED1, NAT1, ATIC, SCAP were also highlighted in our previous study for their association with SCZ.8
Strengths and Limitations of the Study
To the best of our knowledge, this is the first study that uses ensemble learning for the analysis of genomics data for schizophrenia (SCZ) diagnosis with higher precision. The similar performance of ML models in test data and independent dataset prediction indicates no data leakage in the sample processing workflow. The preprocessing of raw microarray data in this analysis also allows the prediction of a single test sample, suggesting its reliable application in real-world clinical settings. Further, the higher precision offered by ensemble learning seems to perform equally well, irrespective of the biological and technical variations in the datasets. Notably, cross-platform validation confirms the compatibility of transcript-per-million (TPM) normalization of RNA-Seq data with microarray-based ML models for prediction analysis. The ensemble learning approach developed in this study can be used for other disorders that carry a high burden of stigma.
However, there are several limitations to this study. The proposed method for model development is in its preliminary stage and lacks validation with a larger sample size. The unavailability of clinical information for each sample in publicly available datasets restricted its use in developing multi-modal ML models. Additionally, the absence of clinical attributes prevented us from testing the effect of medication status, ethnicity, age, and sex on the performance of the models. The ML model performance in cross-platform validation was relatively poor, suggesting scope for developing better normalization methods. The analysis was restricted to only SCZ and did not attempt multi-class classification as Yang et al did in their study.68 The modest sample size of the case-control study remains a limitation.
Conclusions and Future Directions
In conclusion, our study offers a proof of concept for the development of class prediction models for SCZ with higher precision, indicating its potential application in clinical settings in the future. The current strategy effectively deals with problems like data leakage and preprocessing of single microarray samples. The feature genes and biological pathways identified in this study can be pursued to explore their potential role in the disorder. Most importantly, this study attempted cross-platform class prediction using RNA-Seq data as test samples. However, a relatively poor cross-platform performance indicates the need for better cross-platform normalization techniques. In addition, the availability of data from other high throughput genome-wide studies may create novel avenues for developing multi-modal learning. Specifically, the multi-omic approach integrating genomic, transcriptomic, and proteomic data will surely result in the precise diagnosis of psychiatric disorders.
Abbreviations
ANOVA, Analysis of Variance; AUROC, Area under the Receiver Operating Characteristic curve; CNT, Healthy controls; CPM, Counts per Million; DEG, Differentially Expressed Genes; DGEA, Differential Gene Expression Analysis; DSM-5, Diagnostic and Statistical Manual of Mental Disorders, 5th Edition; GEO, Gene Expression Omnibus; HISAT2, Hierarchical Indexing for Spliced Alignment of Transcripts limma, linear models for microarray data; MCC, Maximal Clique Centrality; ML, Machine learning; PAM, Prediction Analysis of Microarrays; PANSS, Positive And Negative Syndrome Scale; PAST, PAleontological STatistics; PBMCs, Peripheral blood mononuclear cells; PPI, Protein-Protein Interaction; RC, Raw Counts; SCID-5-RV: Structured Clinical Interview for the DSM-5 Research Version; SCZ, Schizophrenia; SD, Standard Deviation; STRING: Search Tool for the Retrieval of Interacting Genes/proteins; SVM, Support Vector Machine; TPM, Transcripts per Million.
Data Sharing Statement
The datasets generated for this study can be found in INDA-CA, INCARP000275.
The R scripts used for the analysis are available on GitHub. (https://github.com/macdlab/2023_VW_SCZ_Ensemble).
Compliance with Ethical Standards
Two independent ethical committees approved the study protocol: the KEM Hospital Research Centre Ethics Committee (KEMHRC ID No. 2001) and Symbiosis International (Deemed University) Independent Ethics Committee (SIU/IEC/99). Written informed consent was obtained from all participants. For participants with schizophrenia, written informed consent was supported by written informed consent of a spouse or a first-degree relative aged 18 and above. Parents, siblings, and children were considered first-degree relatives. Clinical interviews were administered by a trained psychiatrist and a psychologist in private. The diagnosis was confirmed by a senior psychiatrist. The identity of the participants was protected by using a unique identification number. The data collected in the study are securely stored with restricted access. Any data sharing with other researchers will prioritize participant confidentiality, ensuring identities remain undisclosed. All the participants were compensated for their travel and time.
Acknowledgments
We sincerely thank all the participants, their parents, relatives, and caretakers for their time and generous participation in making this project possible. We thank Deepa Raut, phlebotomist KEMHRC for her valuable contribution to the blood collection process. We would also like to thank Paul Tooney (Associate professor, New Castle University, Australia) for sharing data on request. VVW thanks UGC, New Delhi for the research fellowship.
Author Contributions
All authors made a significant contribution to the work reported, whether that is in the conception, study design, execution, acquisition of data, analysis and interpretation, or in all these areas; took part in drafting, revising or critically reviewing the article; gave final approval of the version to be published; have agreed on the journal to which the article has been submitted; and agree to be accountable for all aspects of the work.
Funding
The study was funded by an intramural research grant (MjRP/19-20/1516) from Symbiosis Centre for Research & Innovation (SCRI), SIU, Pune, India.
Disclosure
The authors state that there is no conflict of interest.
References
1. Costa E, Silva JA. Nations for mental health: an action programme on mental health for underserved populations; 1998.
2. Hennekens CH, Hennekens AR, Hollar D, Casey DE. Schizophrenia and increased risks of cardiovascular disease. Am Heart J. 2005;150(6):1115–1121. doi:10.1016/j.ahj.2005.02.007
3. Laursen TM, Nordentoft M, Mortensen PB. Excess early mortality in schizophrenia. Annu Rev Clin Psychol. 2014;10:425–448. doi:10.1146/annurev-clinpsy-032813-153657
4. Solmi M, Seitidis G, Mavridis D, et al. Incidence, prevalence, and global burden of schizophrenia - data, with critical appraisal, from the Global Burden of Disease (GBD) 2019. Mol Psychiatry. 2023. doi:10.1038/s41380-023-02138-4
5. American Psychiatric Association. Diagnostic and Statistical Manual of Mental Disorders.
6. GBD 2017 Disease and Injury Incidence and Prevalence Collaborators G 2017 D and II and P. Global, regional, and national incidence, prevalence, and years lived with disability for 354 diseases and injuries for 195 countries and territories, 1990–2017: a systematic analysis for the Global Burden of Disease Study 2017. Lancet. 2018;392(10159):1789–1858. doi:10.1016/S0140-6736(18)32279-7
7. Chan MK, Gottschalk MG, Haenisch F, et al. Applications of blood-based protein biomarker strategies in the study of psychiatric disorders. Prog Neurobiol. 2014;122:45–72. doi:10.1016/j.pneurobio.2014.08.002
8. Wagh VV, Vyas P, Agrawal S, Pachpor TA, Paralikar V, Khare SP. Peripheral blood-based gene expression studies in schizophrenia: a systematic review. Front Genet. 2021;12. doi:10.3389/fgene.2021.736483
9. Hess JL, Tylee DS, Barve R, et al. Transcriptomic abnormalities in peripheral blood in bipolar disorder, and discrimination of the major psychoses. Schizophr Res. 2020;217:124–135. doi:10.1016/j.schres.2019.07.036
10. Zhu L, Wu X, Xu B, et al. The machine learning algorithm for the diagnosis of schizophrenia on the basis of gene expression in peripheral blood. Neurosci Lett. 2021:745. doi:10.1016/j.neulet.2020.135596
11. Ke P-F, Xiong D-S, Li J-H, et al. An integrated machine learning framework for a discriminative analysis of schizophrenia using multi-biological data. Sci Rep. 2021;11(1):14636. doi:10.1038/s41598-021-94007-9
12. Bhandari N, Walambe R, Kotecha K, Khare SP. A comprehensive survey on computational learning methods for analysis of gene expression data. Front Mol Biosci. 2022;9:907150. doi:10.3389/fmolb.2022.907150
13. Liu S, Lu T, Zhao Q, et al. A machine learning model for predicting patients with major depressive disorder: a study based on transcriptomic data. Front Neurosci. 2022;16. doi:10.3389/fnins.2022.949609
14. Yu JS, Xue AY, Redei EE, Bagheri N. A support vector machine model provides an accurate transcript-level-based diagnostic for major depressive disorder. Transl Psychiatry. 2016;6(10):e931. doi:10.1038/tp.2016.198
15. Wu X, Zhu L, Zhao Z, et al. Application of machine learning in diagnostic value of mRNAs for bipolar disorder. Nord J Psychiatry. 2022;76(2):81–88. doi:10.1080/08039488.2021.1937311
16. Hess JL, Tylee DS, Barve R, et al. Transcriptome-wide mega-analyses reveal joint dysregulation of immunologic genes and transcription regulators in brain and blood in schizophrenia. Schizophr Res. 2016;176(2–3):114–124. doi:10.1016/j.schres.2016.07.006
17. Van Zelst C. Stigmatization as an environmental risk in schizophrenia: a user perspective. Schizophr Bull. 2009;35(2):293. doi:10.1093/SCHBUL/SBN184
18. Adil M, Atiq I, Ellahi A. Stigmatization of schizophrenic individuals and its correlation to the fear of violent offence. Should we be concerned? Ann Med Surg. 2022;82:104666. doi:10.1016/J.AMSU.2022.104666
19. Lauber C, Rössler W. Stigma towards people with mental illness in developing countries in Asia. Int Rev Psychiatry. 2007;19(2):157–178. doi:10.1080/09540260701278903
20. Thirthalli J, Kumar CN. Stigma and disability in schizophrenia: developing countries’ perspective. Int Rev Psychiatry. 2012;24(5):423–440. doi:10.3109/09540261.2012.703644
21. Cortes C, Vapnik V. Support-vector networks. Mach Learn. 1995;20(3):273–297. doi:10.1007/BF00994018
22. Tibshirani R, Hastie T, Narasimhan B, Chu G. Diagnosis of multiple cancer types by shrunken centroids of gene expression. Proc Natl Acad Sci U S A. 2002;99(10):6567. doi:10.1073/PNAS.082099299
23. Edgar R, Domrachev M, Lash AE. Gene expression omnibus: NCBI gene expression and hybridization array data repository. Nucleic Acids Res. 2002;30(1):207–210. doi:10.1093/nar/30.1.207
24. Parkinson H, Kapushesky M, Shojatalab M, et al. ArrayExpress - A public database of microarray experiments and gene expression profiles. Nucleic Acids Res. 2007;35(Suppl 1):747–750. doi:10.1093/nar/gkl995
25. R Core Team. R: A Language and Environment for Statistical Computing. Vienna, Austria: R Foundation for Statistical Computing; 2020.
26. Braschi B, Denny P, Gray K, et al. Genenames.org: the HGNC and VGNC resources in 2019. Nucleic Acids Res. 2019;47(D1):D786–D792. doi:10.1093/nar/gky930
27. Bolstad B preprocessCore: a collection of preprocessing functions; 2020. Available from: https://github.com/bmbolstad/preprocessCore.
28. Leek JT, Johnson WE, Parker HS, et al. Package ”sva” Title Surrogate Variable Analysis; 2020. Available from: https://bioconductor.org/packages/sva/.
29. Ritchie ME, Phipson B, Wu D, et al. limma powers differential expression analyses for RNA-sequencing and microarray studies. Nucleic Acids Res. 2015;43(7):e47–e47. doi:10.1093/NAR/GKV007
30. Meyer D, Dimitriadou E, Hornik K, Weingessel A, Leisch F e1071: misc Functions of the Department of Statistics, Probability Theory Group (Formerly: E1071), TU Wien. R. 2021. Available from: https://CRAN.R-project.org/package=e1071.
31. Hastie T, Tibshirani R, Narasimhan B, Chu G pamr: pam: prediction analysis for microarrays. R package; 2019. Available from: https://cran.r-project.org/package=pamr.
32. Raudvere U, Kolberg L, Kuzmin I, et al. g:Profiler: a web server for functional enrichment analysis and conversions of gene lists (2019 update). Nucleic Acids Res. 2019;47(W1):W191–W198. doi:10.1093/nar/gkz369
33. Szklarczyk D, Gable AL, Lyon D, et al. STRING v11: protein-protein association networks with increased coverage, supporting functional discovery in genome-wide experimental datasets. Nucleic Acids Res. 2019;47(D1):D607–D613. doi:10.1093/NAR/GKY1131
34. Shannon P, Markiel A, Ozier O, et al. Cytoscape: a software environment for integrated models of biomolecular interaction networks. Genome Res. 2003;13(11):2498–2504. doi:10.1101/gr.1239303
35. Chin C-H, Chen S-H, H-H W, C-W H, M-T K, Lin C-Y. cytoHubba: identifying hub objects and sub-networks from complex interactome. BMC Syst Biol. 2014;8(Suppl 4):S11. doi:10.1186/1752-0509-8-S4-S11
36. First MB, Williams JB. Structured clinical interview for DSM-5-Research version. Am Psychiatry Assoc. 2015;5:1–94.
37. Kay SR, Fiszbein A, Opler LA. The Positive and Negative Syndrome Scale (PANSS) for Schizophrenia. Schizophr Bull. 1987;13(2):261–276. doi:10.1093/schbul/13.2.261
38. Andrews S FastQC: a quality control tool for high throughput sequence data; 2010. Available from: https://www.bioinformatics.babraham.ac.uk/projects/fastqc/.
39. Frankish A, Diekhans M, Ferreira AM, et al. GENCODE reference annotation for the human and mouse genomes. Nucleic Acids Res. 2019;47(D1):D766–D773. doi:10.1093/nar/gky955
40. Kim D, Paggi JM, Park C, Bennett C, Salzberg SL. Graph-based genome alignment and genotyping with HISAT2 and HISAT-genotype. Nat Biotechnol. 2019;37(8):907–915. doi:10.1038/s41587-019-0201-4
41. Liao Y, Smyth GK, Shi W. featureCounts: an efficient general purpose program for assigning sequence reads to genomic features. Bioinformatics. 2014;30(7):923–930. doi:10.1093/bioinformatics/btt656
42. Zaiontz C Real Statistics Using Excel; 2020. Available from: www.real-statistics.com.
43. Hammer Ø, Harper DAT, Ryan PD Past: paleontological statistics software package for education and data analysis; 2001.
44. Sing T, Sander O, Beerenwinkel N, Lengauer T. ROCR: visualizing classifier performance in R. Bioinformatics. 2005;21(20):3940–3941. doi:10.1093/BIOINFORMATICS/BTI623
45. Bousman CA, Chana G, Glatt SJ, et al. Preliminary evidence of ubiquitin proteasome system dysregulation in schizophrenia and bipolar disorder: convergent pathway analysis findings from two independent samples. Am J Med Genet B Neuropsychiatr Genet. 2010;153B(2):494–502. doi:10.1002/ajmg.b.31006
46. van Beveren NJM, Buitendijk GHS, Swagemakers S, et al. Marked reduction of AKT1 expression and deregulation of AKT1-associated pathways in peripheral blood mononuclear cells of schizophrenia patients. PLoS One. 2012;7(2). doi:10.1371/journal.pone.0032618
47. de Jong S, Boks MPM, Fuller TF, et al. A gene co-expression network in whole blood of schizophrenia patients is independent of antipsychotic-use and enriched for brain-expressed genes. PLoS One. 2012;7(6):e39498. doi:10.1371/journal.pone.0039498
48. Stoll G, Pietiläinen OPH, Linder B, et al. Deletion of TOP3β, a component of FMRP-containing mRNPs, contributes to neurodevelopmental disorders. Nat Neurosci. 2013;16(9):1228–1237. doi:10.1038/nn.3484
49. Xu Y, Yao Shugart Y, Wang G, et al. Altered expression of mRNA profiles in blood of early-onset schizophrenia. Sci Rep. 2016;6(1):16767. doi:10.1038/srep16767
50. Kumarasinghe N, Beveridge NJ, Gardiner E, et al. Gene expression profiling in treatment-naive schizophrenia patients identifies abnormalities in biological pathways involving AKT1 that are corrected by antipsychotic medication. Int J Neuropsychopharmacol. 2013;16(07):1483–1503. doi:10.1017/S1461145713000035
51. Vachev TI, Stoyanova VK, Ivanov HY, Minkov IN, Popov NT. Investigation of Fasciculation and Elongation Protein ζ-1 (FEZ1) in peripheral blood reveals differences in gene expression in patients with schizophrenia. Balk J Med Genet. 2015;18(1):31–38. doi:10.1515/bjmg-2015-0003
52. V. TS, Hecher L, Schafflick D, et al. Dysregulation of a specific immune-related network of genes biologically defines a subset of schizophrenia. Transl Psychiatry. 2019;9(1). doi:10.1038/S41398-019-0486-6
53. Okazaki S, Boku S, Otsuka I, et al. The cell cycle-related genes as biomarkers for schizophrenia. Prog Neuro Psychopharmacol Biol Psychiatr. 2016;70:85–91. doi:10.1016/j.pnpbp.2016.05.005
54. Tsuang MT, Nossova N, Yager T, et al. Assessing the validity of blood-based gene expression profiles for the classification of schizophrenia and bipolar disorder: a preliminary report. Am J Med Genet. 2005;133(1):1–5. doi:10.1002/ajmg.b.30161
55. Middleton FA, Pato CN, Gentile KL, et al. Gene expression analysis of peripheral blood leukocytes from discordant sib-pairs with schizophrenia and bipolar disorder reveals points of convergence between genetic and functional genomic approaches. Am J Med Genet Part B Neuropsychiatr Genet. 2005;136B(1):12–25. doi:10.1002/ajmg.b.30171
56. Zhang H, Xie Z, Yang Y, Zhao Y, Zhang B, Fang J. The correlation-base-selection algorithm for diagnostic schizophrenia based on blood-based gene expression signatures. Biomed Res Int. 2017;2017. doi:10.1155/2017/7860506
57. Dmitrieva E, Smirnova L, Seregin A, Zgoda V, Semke A, Ivanova S. Proteomic profile of serum from patients with schizophrenia spectrum disorders. PeerJ. 2022;10:e13907. doi:10.7717/peerj.13907
58. Ng F, Berk M, Dean O, Bush AI. Oxidative stress in psychiatric disorders: evidence base and therapeutic implications. Int J Neuropsychopharmacol. 2008;11(6):851–876. doi:10.1017/S1461145707008401
59. Gonzalez-liencres C, Tas C, Brown EC, et al. Oxidative stress in schizophrenia: a case – control study on the effects on social cognition and neurocognition. BMC Psychiatry. 2014:1–9. doi:10.1186/s12888-014-0268-x
60. Yovel G, Sirota P, Mazeh D, Shakhar G, Rosenne E, Ben-Eliyahu S. Higher natural killer cell activity in schizophrenic patients: the impact of serum factors, medication, and smoking. Brain Behav Immun. 2000;14(3):153–169. doi:10.1006/brbi.1999.0574
61. Van Kesteren CFMG, Gremmels H, De Witte LD, et al. Immune involvement in the pathogenesis of schizophrenia: a meta-analysis on postmortem brain studies. Transl Psychiatry. 2017;7(3). doi:10.1038/tp.2017.4
62. Parellada E, Gassó P. Glutamate and microglia activation as a driver of dendritic apoptosis: a core pathophysiological mechanism to understand schizophrenia. Transl Psychiatry. 2021;11(1):271. doi:10.1038/s41398-021-01385-9
63. Ripke S, Neale BM, Corvin A, et al. Biological insights from 108 schizophrenia-associated genetic loci. Nature. 2014;511(7510):421–427. doi:10.1038/nature13595
64. Pardiñas AF, Holmans P, Pocklington AJ, et al. Common schizophrenia alleles are enriched in mutation-intolerant genes and in regions under strong background selection. Nat Genet. 2018;50(3):381–389. doi:10.1038/s41588-018-0059-2
65. Fromer M, Roussos P, Sieberts SK, et al. Gene expression elucidates functional impact of polygenic risk for schizophrenia. Nat Neurosci. 2016;19(11):1442–1453. doi:10.1038/NN.4399
66. Gardiner EJ, Cairns MJ, Liu B, et al. Gene expression analysis reveals schizophrenia-associated dysregulation of immune pathways in peripheral blood mononuclear cells. J Psychiatr Res. 2013;47(4):425–437. doi:10.1016/j.jpsychires.2012.11.007
67. Sun L, Cheng Z, Zhang F, Xu Y. Gene expression profiling in peripheral blood mononuclear cells of early-onset schizophrenia. Genomics Data. 2015;5:169–170. doi:10.1016/j.gdata.2015.04.022
68. Yang Q, Li Y, Li B, Gong Y. A novel multi-class classification model for schizophrenia, bipolar disorder and healthy controls using comprehensive transcriptomic data. Comput Biol Med. 2022;148. doi:10.1016/J.COMPBIOMED.2022.105956
 © 2024 The Author(s). This work is published and licensed by Dove Medical Press Limited. The full terms of this license are available at https://www.dovepress.com/terms.php and incorporate the Creative Commons Attribution - Non Commercial (unported, v3.0) License.
By accessing the work you hereby accept the Terms. Non-commercial uses of the work are permitted without any further permission from Dove Medical Press Limited, provided the work is properly attributed. For permission for commercial use of this work, please see paragraphs 4.2 and 5 of our Terms.
© 2024 The Author(s). This work is published and licensed by Dove Medical Press Limited. The full terms of this license are available at https://www.dovepress.com/terms.php and incorporate the Creative Commons Attribution - Non Commercial (unported, v3.0) License.
By accessing the work you hereby accept the Terms. Non-commercial uses of the work are permitted without any further permission from Dove Medical Press Limited, provided the work is properly attributed. For permission for commercial use of this work, please see paragraphs 4.2 and 5 of our Terms.