")
Back to Journals » Drug Design, Development and Therapy » Volume 18
Population Pharmacokinetics and Model-Based Dose Optimization of Vancomycin in Sudanese Adult Patients with Renal Impairment
Authors Ahmed KA , Ibrahim A , Gonzalez D , Nur AO
Received 26 July 2023
Accepted for publication 22 December 2023
Published 16 January 2024 Volume 2024:18 Pages 81—95
DOI https://doi.org/10.2147/DDDT.S432439
Checked for plagiarism Yes
Review by Single anonymous peer review
Peer reviewer comments 2
Editor who approved publication: Dr Georgios Panos
Khalid Altigani Ahmed,1 Alnada Ibrahim,2 Daniel Gonzalez,3 Abubakr O Nur4
1Department of Clinical Pharmacy, College of Pharmacy, Najran University, Najran, Saudi Arabia; 2Department of Pharmacy Practice, College of Pharmacy, Princess Nourah bint Abdulrahman University, Riyadh, Saudi Arabia; 3Division of Clinical Pharmacology, Department of Medicine, Duke University School of Medicine, Durham, NC, USA; 4Department of Pharmaceutics, Faculty of Pharmacy, University of Khartoum, Khartoum, Sudan
Correspondence: Alnada Ibrahim, Department of Pharmacy Practice, College of Pharmacy, Princess Nourah bint Abdulrahman University, P.O. Box 84428, Riyadh, 11671, Saudi Arabia, Email [email protected]
Purpose: The study aimed to perform a population pharmacokinetic (PK) analysis to obtain vancomycin PK parameter estimates in Sudanese adult patients. The population PK model is then applied to perform model-based dose optimization.
Patients and Methods: Data were collected through a retrospective, single-center, observational cohort study performed in Aliaa Specialist Hospital, Khartoum, Sudan. A population PK model was developed using the MonolixSuite 2020R1 to explore the potential effects of demographics and laboratory covariates on vancomycin PK. Monte Carlo simulations were performed to optimize dosage regimens as a function of creatinine clearance (CLcr) and virtual patients were partitioned into five CLcr groups.
Results: We retrospectively collected 194 vancomycin plasma concentrations from 99 adults. The median (interquartile range) for age (years) and CLcr (mL/min) were 65 (50– 75) and 12.7 (5.52– 25.78), respectively. Vancomycin PK data were best fitted using a one-compartment model with linear elimination. The estimates of clearance and volume of distribution were 2.02 L/h and 65 L, respectively. CLcr was identified as the main covariate explaining the PK variability in vancomycin CL. CL significantly decreased with decreasing CLcr. For the five CLcr groups evaluated, a tailored vancomycin daily maintenance dose (using patients’ CLcr) ranged from 200 to 1650 mg. Overall, simulations showed that 45% (CI; 41.11– 47.36%) of patients would achieve a target AUC with the suggested dosages.
Conclusion: A population PK model of vancomycin was developed using data obtained from adult Sudanese patients. Model-based dose optimization can aid clinicians in selecting initial vancomycin doses that will maximize the likelihood of a favorable treatment response.
Keywords: vancomycin, dose individualization, monitoring, pharmacokinetics dosing, pharmacometrics
Introduction
Vancomycin is a first-line therapy for methicillin-resistant Staphylococcus aureus (MRSA), and therapeutic drug monitoring (TDM) is performed to reduce the risk of nephrotoxicity and assure optimal therapeutic outcomes. Several organizations have produced clinical practice recommendations to guide TDM of vancomycin.1,2 The minimum inhibitory concentration (MIC) of vancomycin against MRSA continues to rise due to its extensive use.3 On the other hand, vancomycin’s pharmacokinetic (PK) parameters have wide variability among the different patient populations that receive the drug.4,5 Therefore, dose individualization based on MIC and patient-specific factors is essential to achieving an optimal outcome.
Vancomycin is primarily eliminated through renal elimination, and its clearance (CL) is closely linked to creatinine clearance (CLcr). As a result, the main source of vancomycin PK parameter fluctuations is renal function.6 Vancomycin PK parameters have a wide range of values. According to a review paper on vancomycin population PK studies in adult patients, the typical values of vancomycin CL ranged from 0.334 to 8.75 L/h. The volume of distribution (V) ranged from 7.12 to 154 L and 29.2 to 501.8 L in the case of one- and two-compartment models, respectively. The between-subject variability (BSV) was reported to be as high as 77% for V and 99% for CL.7
Recent guidelines recommend targeting an area under the concentration vs time curve (AUC)/minimum inhibitory concentration (MIC) ratio of 400 to 600 (assuming an MIC of 1 mg/L) for empiric dosing in both adult and pediatric patients to maximize clinical efficacy and minimize acute kidney injury (AKI) risk.2
Population PK modeling and simulation have helped identify the optimal dosing of vancomycin by assessing the inter- and intra-subject variability in PK. Previous studies reported that vancomycin trough concentrations and race were risk factors of vancomycin-related AKI, among other risk factors.8–10 Hence, the importance of vancomycin trough level and renal function close monitoring was highlighted. Race can impact drug pharmacokinetics through various mechanisms, including genetic variations, differences in drug metabolism, and variations in protein binding.11 As elimination of vancomycin is almost exclusively renal, protein binding and genetic polymorphisms in transporters involved in renal drug excretion may be the place for ethnicity and race differences rather than metabolism. Renal function has also been reported as a determinant of vancomycin PK.12 As no information about vancomycin population PK is known for Sudanese patients, this study aimed to perform a population PK analysis to obtain vancomycin PK parameter estimates in Sudanese adult patients. Then, we sought to compare the PK parameter estimates to those reported in the literature and perform model-based dose optimization.
Materials and Methods
Study Design and Setting
This study was a retrospective, single-center, observational cohort study performed in Aliaa Specialist Hospital, Khartoum, Sudan.
Ethics Approval
The study was approved by the Institutional Review Board, General Directorate of Medical Services - Aliaa Specialist Hospital, with a log number: GMS.ASH.Aug 2021. A waiver of informed consent was granted by the Institutional Review Board. This was based on the understanding that the waiver will not adversely affect the rights and welfare of the subjects. Only data essential to the current study was extracted from medical records by two nurses from the hospital. This strategy was implemented to limit exposure of the patient’s entire medical record during the data collection process. Moreover, the risk to privacy was considered to be reasonable in relation to the importance of the knowledge to be added in the area of population pharmacokinetics in Sudanese patients. To ensure confidentiality and anonymity of patients’ data, access to the data was restricted and identifiers were removed. This study was conducted in accordance with the Declaration of Helsinki.
Patients and Data Collection
Medical records from the institutional database for patients admitted to Aliaa Specialist Hospital were reviewed, and patients receiving vancomycin between August 2016 and January 2019 were identified. Patients were excluded according to the following criteria: (i) age less than 18 years; (ii) pregnancy; or (iii) renal replacement therapy.
Data collected on each patient included sex, age, serum creatinine, blood urea nitrogen, and vancomycin-related information (dose, time, date, and serum level). In addition, CLcr was estimated using a method developed by Bjornson13 based on Equation 1. Because the data lacked patient weight and height, the Cockcroft-Gault equation was not used.

Where CLcr: creatinine clearance; Rcr: rate of creatinine production; SCR: serum creatinine, and Rcr is different for males and females.
The equations used for Rcr are those developed by Bjornson, as shown in Equations 2 and 3.


Dosing and Sample Collection
Patients were treated with the usual dose of 500–1000 mg of vancomycin every 12 h as an intravenous (IV) infusion over 60 min. Starting with the fourth dose, a blood sample (3–5 mL) was collected for TDM 30 min before the administration of the next dose (for trough concentration measurement) and 1 h after the dose administration for peak concentration.
Vancomycin Assay
Vancomycin plasma concentration measurement was performed using the enzyme-multiplied immunoassay technique (EMIT)14 according to the manufacturer’s instructions. The calibration range was 2–50 mg/l (1.3–34 µmol/L), with less than 10% fluctuation between and within days.
Statistical Analysis
Population Pharmacokinetic Analysis
A population PK model was developed using the MonolixSuite 2020R1. The stochastic approximation expectation maximization (SAEM) algorithm was used. One- and two-compartment models with first-order elimination were evaluated to fit vancomycin serum concentrations as base PK models. The model selection was based on (i) goodness-of-fit (GOF), including residual plots and the observed versus predictive concentration, (ii) a decrease in the objective function value (log-likelihood value), (iii) the precision of the parameter estimation (RSE%), and (iv) the Bayesian information criterion (BIC). Individual parameters are assumed to be log-normally distributed, and an exponential model describes the BSV. The proportional and combined error models were tested to describe residual unexplained variability (RUV).
Investigated covariates in this study included gender, age, serum creatinine, serum albumin, and creatinine clearance. Continuous covariates are included in the model by using log transformed functions, as it is required to model power function that is centered in Monolix. For example, to model CLcr on CL the following formula was used:


which is equivalent to centering power formulae of:

After the base model selection, the empirical Bayesian estimates were plotted versus the covariates for potentially significant correlations. Possible covariates were added to the model by stepwise forward inclusion and backward elimination with the help of MonolixSuite automated covariate selection methodology.
Model Evaluation
Model evaluation was based on GOF plots, including the plotting of observations versus individual and population predictions and individual and conditional weighted residuals versus time after last dose (TAD). The prediction-corrected visual predictive checks (VPC) were constructed with the 5th, 50th, and 95th percentile of the simulated profiles and compared with observed data. The normalized prediction distribution error (NPDE) versus population predictions and bootstrap analysis including 1000 resampled estimations were used to evaluate the stability of the model and the precision of the parameter estimates.15
Model-Based Dose Optimization
Using Monte Carlo simulation with the final population model estimates, different dose regimens were simulated for five groups of different CLcr levels ranging from 10 to 59 mL/min with 10 mL/min increments. For each CLcr group, 1000 random values (according to the range of CLcr values for each group) were generated using the R software. The plasma concentrations were simulated for 1000 patients at each level of CLcr with a tailored dose using Simulx.
To help determine the tailored dose, the PK profile of five virtual patients with CLcr levels of 10, 20, 30, 40, and 50 mL/min were explored by one using the “Exploration” tab in Simulx. By means of a visual check, the area under the concentration vs. time curve from 24 to 48 h (AUC24-48) was evaluated to determine the potentially optimal dose for each group that would lead to a value of AUC24-48 of 400–600 mg.h/L.
For each CLcr group, the optimized dosage was simulated using 1000 virtual patients and their PK profiles were generated. Taking into consideration the variability in random sampling, each simulation was replicated 20 times. The end point considered was the AUC24-48 (which is defined as the target exposure on the second day of therapy), with values of >400 and <600 mg.h/L for efficacy and safety, respectively, based on 2020 IDSA guidelines, assuming an MIC of 1 mg/l.
In some individuals with severe infections, the goal of initial therapy may be to maximize the effect, so a separate set of simulations were performed to identify the dosage that maximizes the proportion of AUC24-48 values > 400 mg.h/L, with an acceptable proportion of ≥0.9.
Overall Statistical Analysis
To test whether any covariates can help explain BSV in PK parameters, the Wald test (automatically performed by MonolixSuite) was used to check if the associated beta coefficient is not zero (ie, H0: the beta parameter estimated by SAEM is equal to zero). Then the covariate was added to the model if it was biologically plausible and there was an improvement in the base model. To assess the latter, a decrease in BSV in the parameter and a decrease in the objective function (log-likelihood value), with significance levels of 0.05 and 0.01 (χ2 distribution with one degree of freedom) for forward inclusion and backward elimination, respectively, were used.
A Shapiro Wilk test is used for testing the normality of the residuals. The null hypothesis is (H0: the residuals are normally distributed).
All analyses other than the population PK were generated using the R software. The results are expressed as median [interquartile range]. Data were described as the median and range for continuous variables and as the number (%) for categorical variables, as appropriate. Graphical presentations were performed using the R software.
The dataset used in this study comprises two observations per person for some patients. These repeated measures with two levels of variability (BSV and residual) may not be independent and hence violation of observational independence is a concern. However, this concern was dealt with by applying the nonlinear mixed-effects modeling approach (multi-level model analysis). As per the United States Food and Drug Administration guidance for population pharmacokinetic analysis, the nonlinear mixed-effects modeling analysis can be applied in situations where repeated measurements are not performed on all or any of the subjects (data-sparse situation), or on data that may be unbalanced.16
Results
Patient Characteristics
The dataset consisted of 194 observations from 99 adult patients of which 67% (n = 66) are males. For all patients, the median CLcr was 12.7 mL/min (IQR: (5.52–25.78)); there were 129 trough concentrations with a median of 16.22 mg/l (IQR: 11.1–26.53), and 65 peak concentrations with a median of 29.35 mg/l (IQR: 22.38–37.36). The trough concentration was sampled 30 min prior to the next dose, while the peak concentration was sampled 1 hr after the dose. Patients received fixed doses (500–1000 mg) that were administered 1 to 2 times per day. No samples were reported below the quantitation limit. A summary of patient characteristics is provided in Table 1.
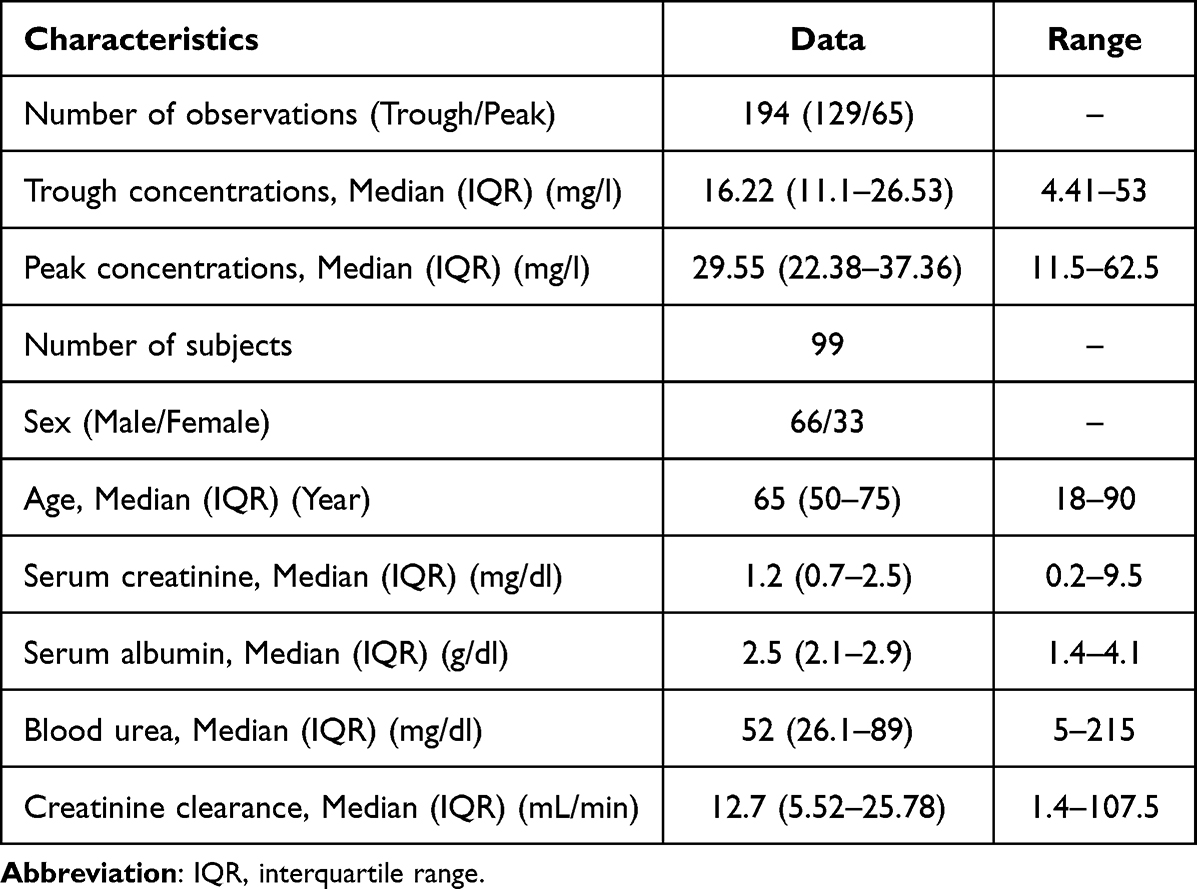 |
Table 1 Summary of Patient Characteristics |
Model Development
Summaries of model development procedures are presented in Table 2. A one-compartment model with first-order elimination best characterized vancomycin’s PK. The inclusion of CLcr and SCR decreased the OFV by 49.7 and 43.7 points, respectively. No other significant association of vancomycin CL with age, sex, blood urea nitrogen, and serum albumin was identified. There was no influence of screened covariates on V. The omega value (BSV standard deviation) for CL decreased from 0.66 to 0.46 and 0.49 after the addition of CLcr and SCR covariate effects, respectively. Given the larger drop in BSV and OFV, the model with CLcr was selected as the final model.
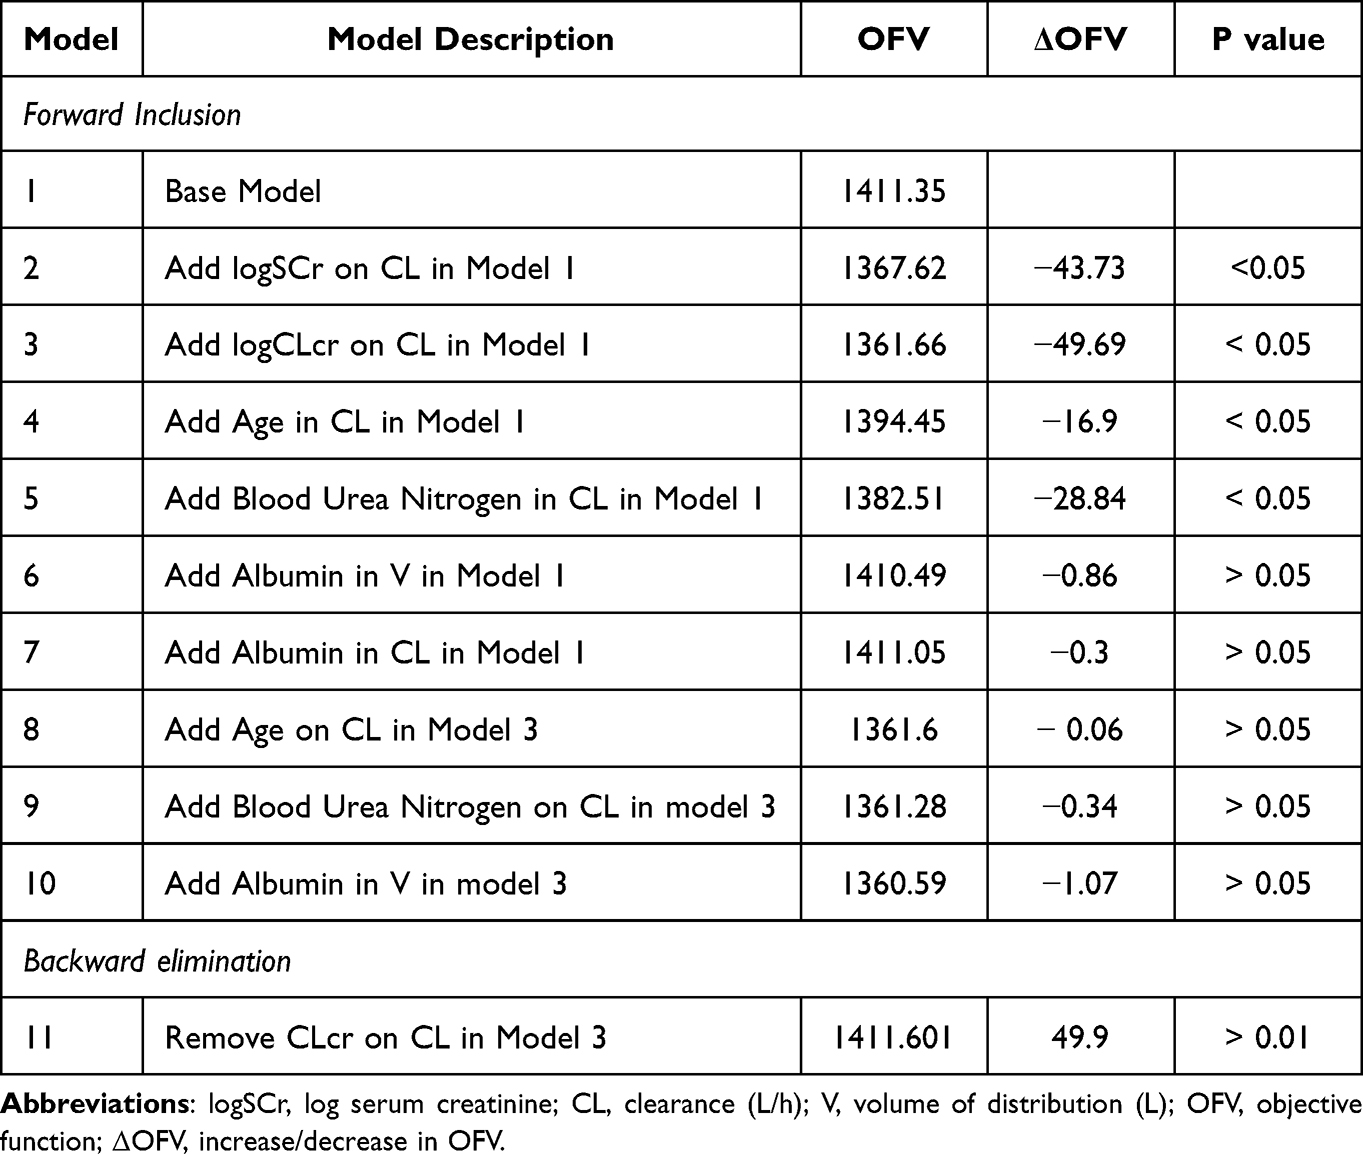 |
Table 2 Summary of the Model Development Process |
The final model estimates with bootstrap results are shown in Table 3. All PK parameters estimated from the final model had relative standard errors that were ˂ 20%.
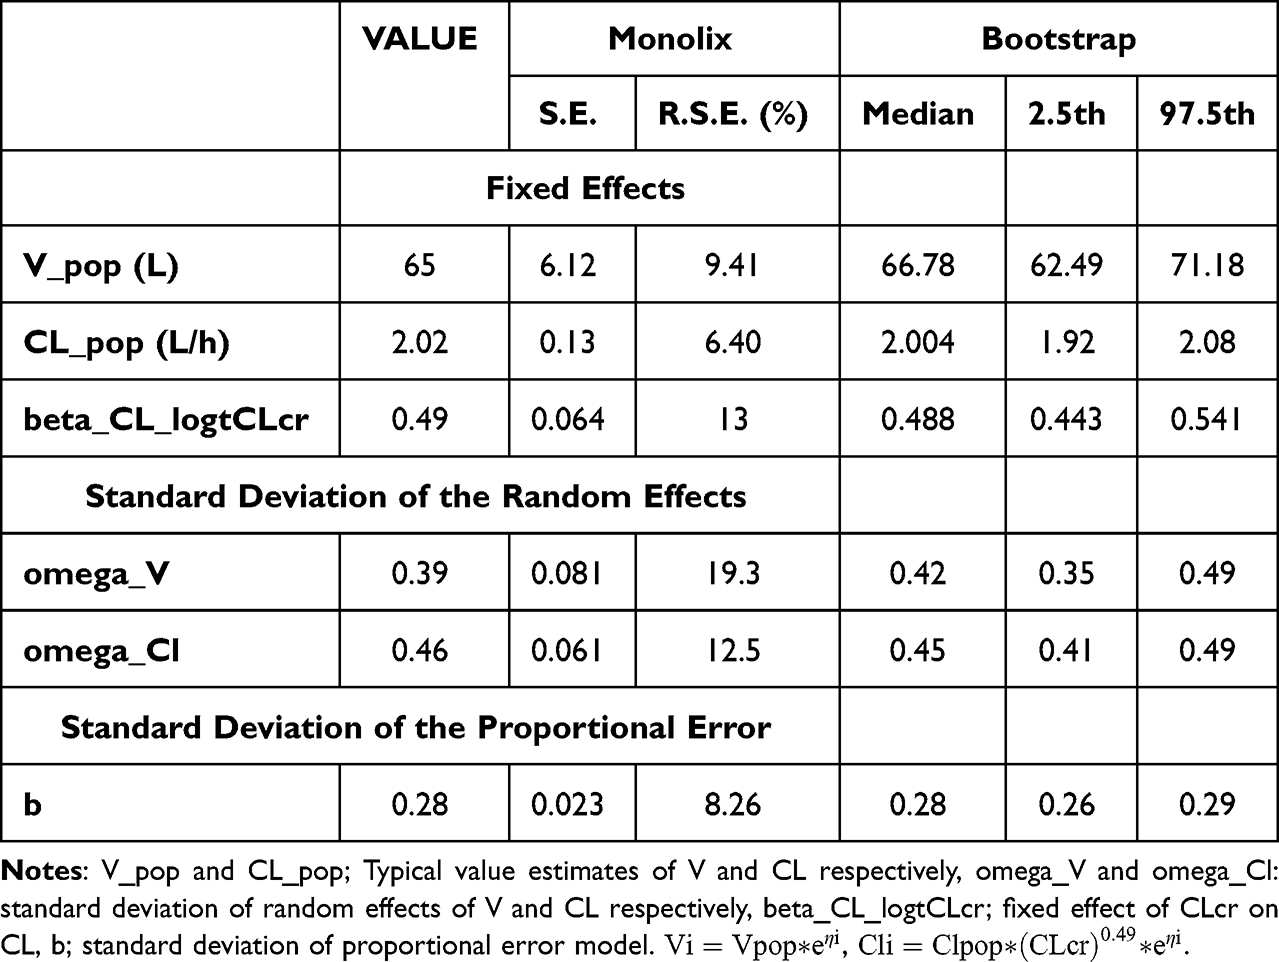 |
Table 3 Population Pharmacokinetic Parameter Estimate from Final Model and Bootstrap Validation |
The final model equations are shown in Equations 4 and 5.


When the patients were divided into five different groups based on CLcr levels, a categorical increase in vancomycin CL was also observed with increasing CLcr (Figure 1).
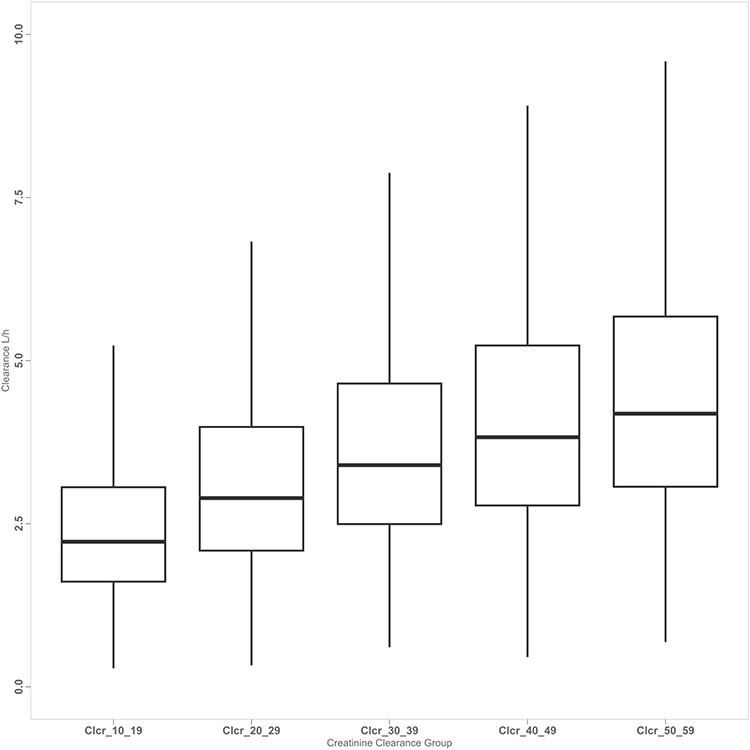 |
Figure 1 Simulated individual vancomycin clearance versus creatinine clearance. |
Model Evaluation
Figures 2–4 show the diagnostic GOF plots for the vancomycin final model. The relative standard error (RSE) of the parameter estimates (shown in Table 3) reveals that all parameters were precisely estimated. The VPC showed a good correlation between the percentile intervals obtained by simulation in the final model and those of the observed data (Figure 5). The performance of the model’s predictions was validated using the NPDE. Based on quantile plots (Figure 3), NPDE distribution, and outcomes of statistical tests, the NPDE had homogeneity of variance and a normal distribution. The Shapiro–Wilk test showed that NPDE distribution was normal (W=−0.117, p-value>0.906). The bootstrap analysis results, and bias are recorded in Table 3. Figure 6 shows a boxplot of the bootstrap results for the population estimates.
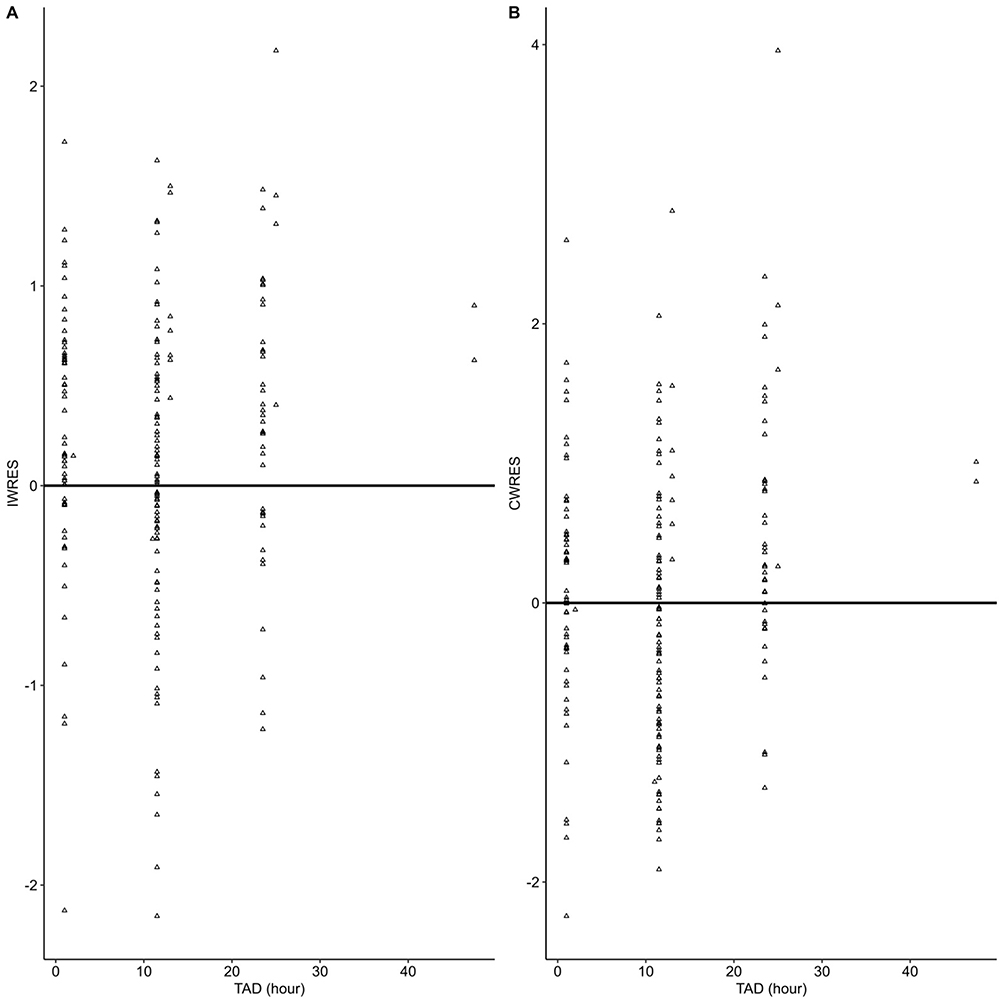 |
Figure 2 Individual and conditional weighted residuals versus time after the last dose (TAD) for the final model. Notes: (A) Individual weight residual error (IWRES) vs time after first dose. (B) Conditional weight residual error (CWRES) vs time after first dose. |
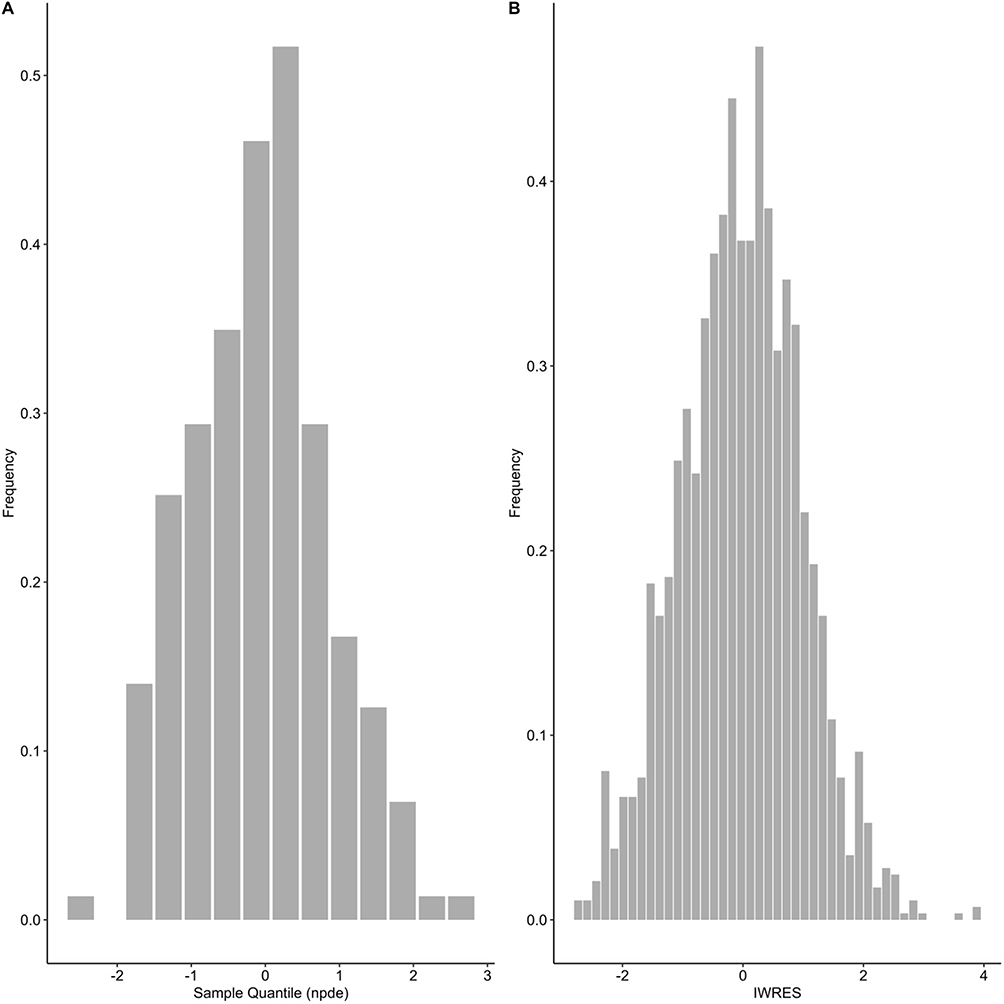 |
Figure 3 Normalized prediction distribution error (NPDE) plots of the observed concentrations and the final model (mean, −0.04612 [P >0.05]; variance, 0.8686326 [P > 0.05]). Notes: (A) Histogram of the distribution of normalized prediction distribution error (NPDE) plots of the observed concentrations. (B) Histogram of the distribution of normalized prediction distribution error (NPDE) plots of the individual weighted predicted concentrations (IWRES) of the final model. |
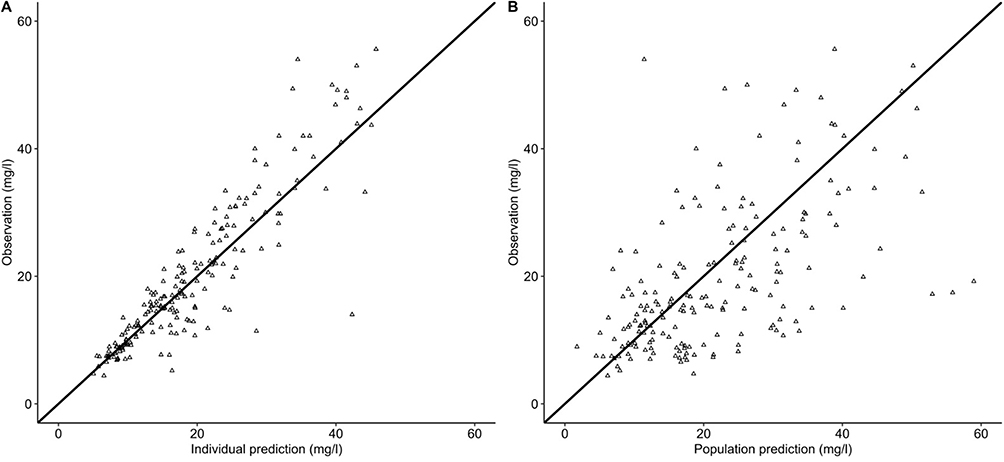 |
Figure 4 Plot of the individual and population predictions versus observations for the final model. Notes: (A) Observations vs individual prediction (OBS-PRED). (B) Observations vs population predicted concentrations (OBS-IPRED). |
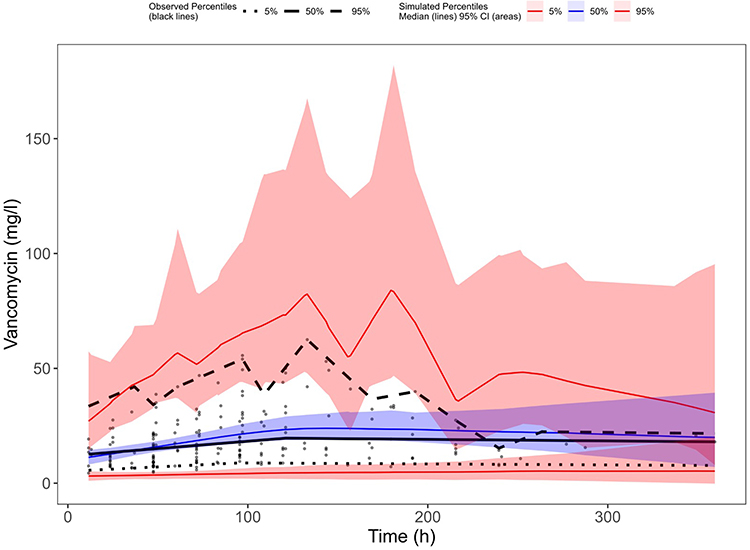 |
Figure 5 Visual predictive check (VPC) for vancomycin concentration versus time after first record for the final model. The dashed and solid black lines represent the 5th, 50th, and 95th percentiles of the observed data. The shaded regions represent the 95% confidence intervals around the 5th, 50th, and 95th percentiles of the simulated data. |
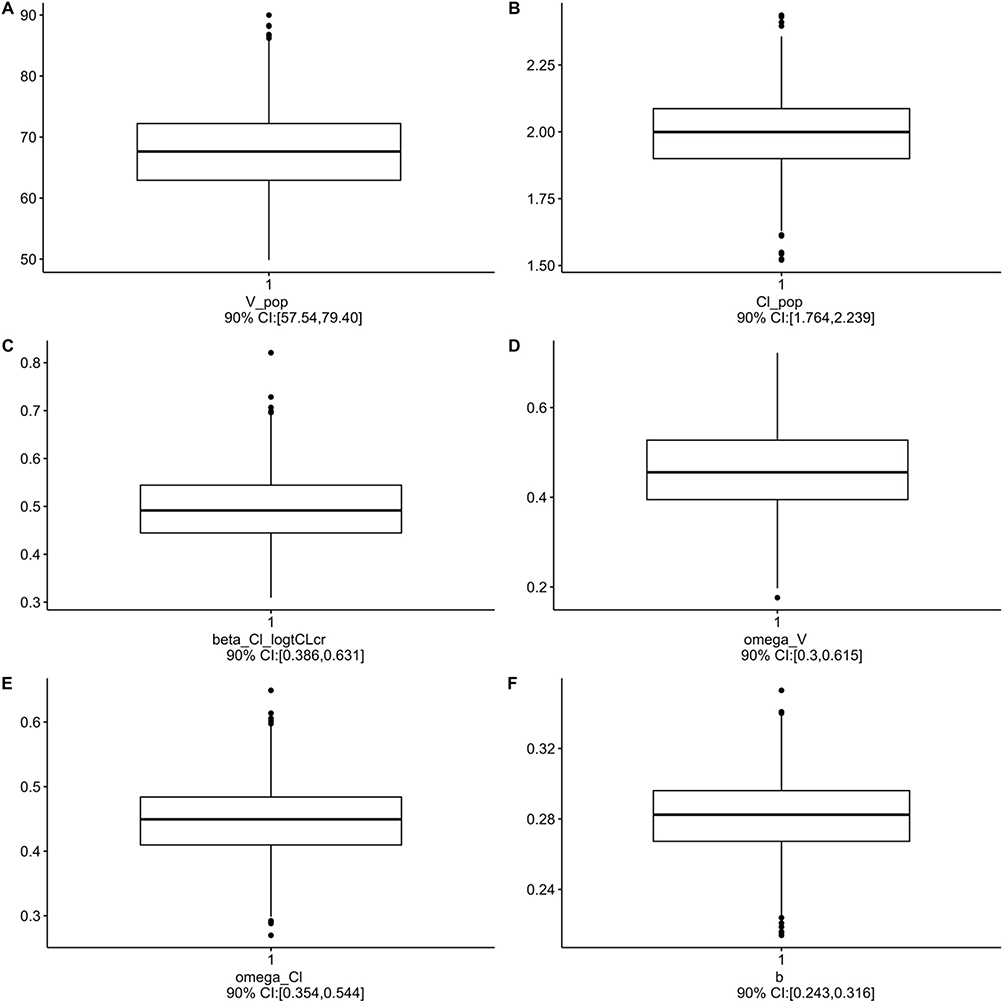 |
Figure 6 Bootstrap result for final model. Notes: (A) V_pop: Typical value estimates of volume of distribution. (B) Cl_pop; Typical value estimates of clearance. (C) beta_Cl_logtCLcr; Fixed effect of creatinine clearance on CL. (D) omega_V: Standard deviation of random effects of volume of distribution. (E) omega_Cl: Standard deviation of random effects clearance. (F) b: Standard deviation of proportional error model. |
Model Application
The results of the Monte Carlo simulation of vancomycin for the five CLcr groups are shown in Table 4. Loading doses of 1500 and 1800 mg for the groups with a CLcr of 10–19 mL/min and 20–59 mL/min, respectively, were applied. The median of probability target attainment of efficacy (AUC24-48 > 400 mg.h/L) ranged from 66% to 74%, while the median risk of overexposure (AUC24-48 > 600 mg.h/L) was 20% to 30%. With the indicated regimens, a total of 45% (95% CI; 42.11–47.36%) of patients would reach the AUC target interval on the second day of medication.
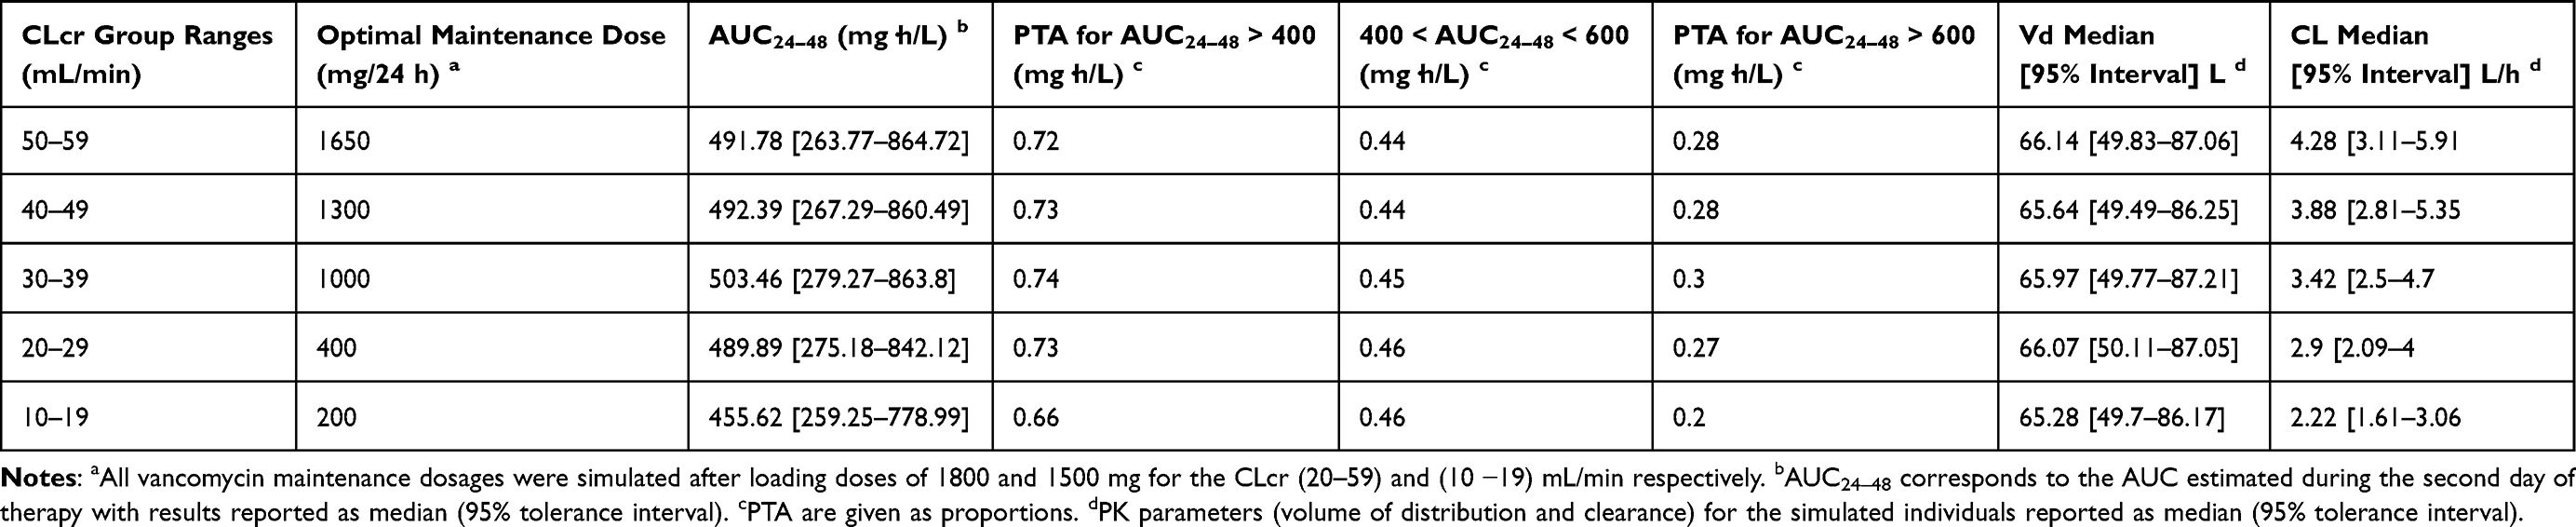 |
Table 4 Optimal Maintenance Dose Based on Simulations with the Final Model |
Table 5 displays the outcomes of the second batch of simulations that aimed for an AUC24-48 > 400. Higher dosages and a reduction in underexposure would be linked with this approach, but it would also increase the likelihood of AUC exceeding the upper bound.
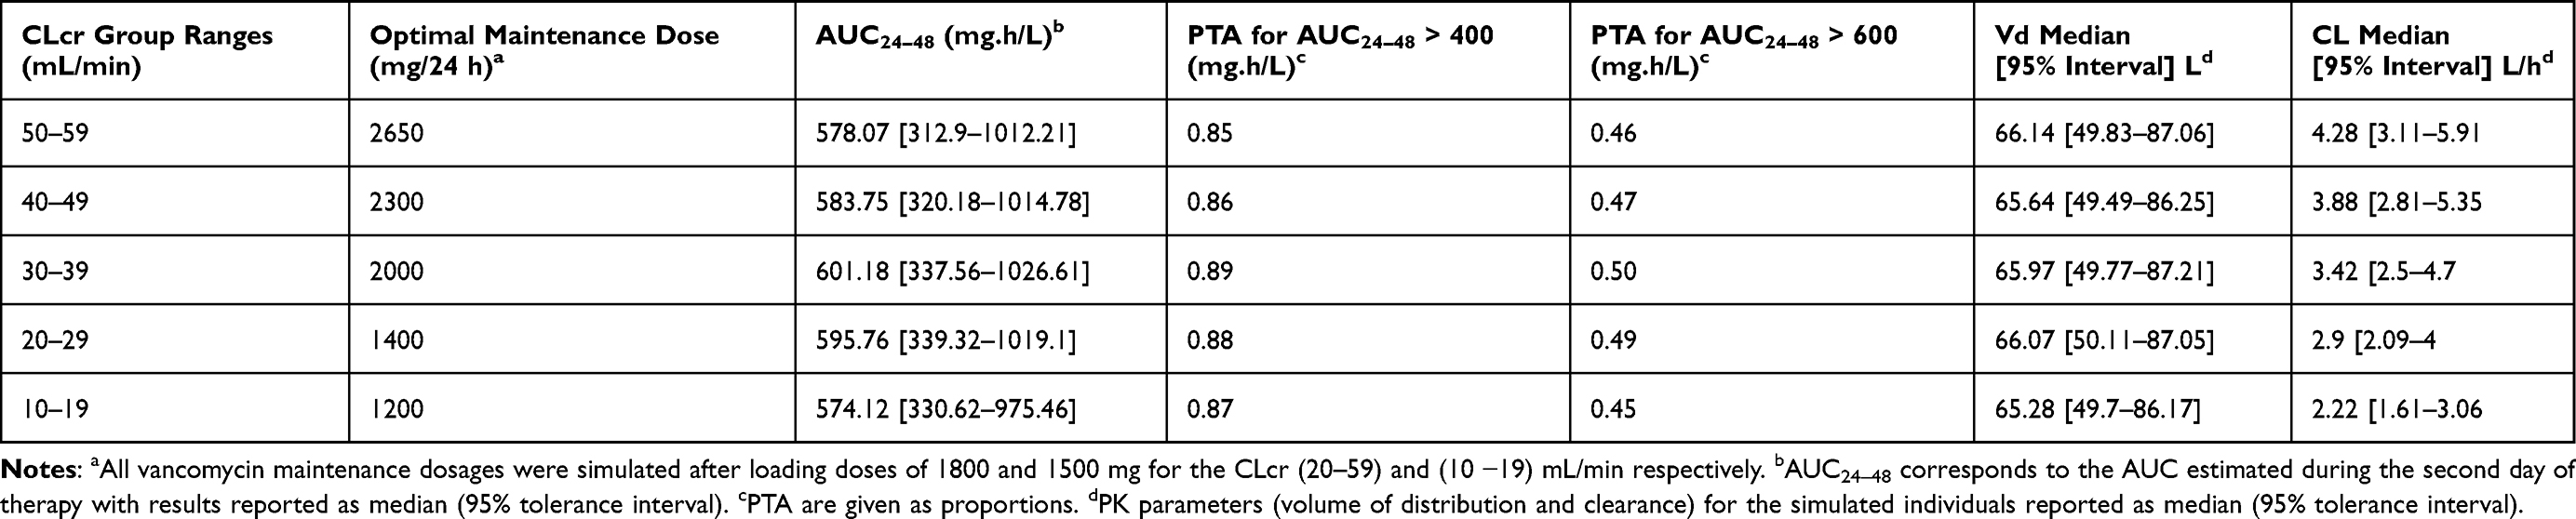 |
Table 5 PK/PD Simulation for Probability of Target Attainment > 90% |
Discussion
We developed a population PK model for vancomycin in Sudanese adult patients. To the authors’ knowledge, this is the first study focused on characterizing vancomycin’s PK in Sudanese patients. The present study shows that the PK of vancomycin in Sudanese patients is properly characterized by a one-compartment model. This is aligned with the previously reported models.16–21 CLcr was identified as the main covariate explaining the PK variability in vancomycin CL. When the patients were divided into five different groups of CLcr levels, a categorical increase in vancomycin CL was observed with increasing CLcr. Using the final model for simulation, we identified a simulated optimal dose to attain serum target concentration with a potential safe range of steady-state trough plasma concentration using patients’ rate of creatinine clearance.
The final model’s typical CL and V values were both within the range reported in the literature.7 The estimated CL (2.02 L/h) was nearly identical to what is seen in other population studies.19,22,23 The typical value of V (65 L) was comparable to previously reported values.18,22,24 During the covariate selection process, the OFV value decreased by 50.22 points (p>0.001) when CLcr was added to the model. Previous studies have reported serum creatinine CLcr as an important covariate explaining BSV in vancomycin’s CL.25–27 The addition of sex as a covariate for CL showed a reduction in the OFV of 6.03 points (p > 0.05) in the forward addition step, but in the backward deletion step, this covariate was not statistically significant, so it was removed from the model (p<0.01).
CLcr was predominantly included as an important influential covariate on vancomycin CL in previous population models.22,23,28–31 Most of the reported vancomycin population pharmacokinetics (PPK) models used CLcr calculated by the Cockcroft–Gault formula, which is influenced by age, weight, sex, and SCR.7 The data lacked some patient information, such as body weight and height, which made the calculation of creatinine clearance using the Cockcroft-Gault equation not possible. In this study, CLcr was estimated using a method developed by Bjornson, where it showed that most patients had renal dysfunction.13 The inclusion of CLcr instead of SCR on CL explained the BSV in vancomycin clearance better, with an omega CL value of 0.46 in comparison to 0.49.
We simulated different dose regimens to investigate the PTA considering safe dose regimens assuming MIC of 1mg/l. A previous study recommended maintenance dose regimens ranging from 875 to 1400 mg (12.5–20 mg/kg) to achieve an AUC24-48 > 400 and <600 mg.h/L in patients with the same CLcr ranges (10–60 mL/min) with 46.6% of the overall patients within the target AUC in comparison to 45% reported in our study.32 With regard to the CLcr subgroups, the simulated dosage regimen based on our model showed a lower range of doses of 200–400 mg in comparison to 875–1050 mg in the patients with CLcr range 10–29 mL/min, and a higher range of dose 1295–1650 mg in comparison to 1225–1400 mg in the patients with CLcr range 40–59 mL/min, to achieve comparable targets of AUC24-48 of that study.
A simulation using a loading dose of 1800 mg in patients with CLcr range 10–19 mL/min showed a median risk of exposure (ie, AUC24-48 > 600) of about 35% in comparison to 20% of the patients with a loading dose of 1500 mg with an overall target interval (ie, AUC24-48, 400–600 mg.h/L) of 45% and 46% of the patients, respectively. Therefore, a loading dose of 1500 mg was chosen for the dosage regimen simulation of these patients. The PK profile of the group with a CLcr of 10–29 mL/min showed a high susceptibility to vancomycin accumulation after the loading dose. This suggests that the selection of the maintenance dose regimen should be guided by plasma concentration measurement in this patient group. In Table 5, the results of a different method of dosing that focused primarily on minimizing underexposure to achieve a probability target > 90% led to greater daily dosages of 1200 to 2650 mg.
One of the main limitations of this study is its retrospective design. Since the data was collected for TDM purposes, only trough and peak samples were available, and no measurements were made at other time points. In addition, some patient information, such as body weight and height, was not included because they were not recorded in patient files, which made the calculation of creatinine clearance using the Cockcroft-Gault equation not possible. Some patients’ characteristics that the study did not address might also affect the findings. These include vancomycin indications that are necessary to specify therapeutic targets accordingly; percentage of patients used vancomycin based on bacterial culture; information about using other nephrotoxic medications that may act as a covariate for nephrotoxicity; and clinical outcomes. In the current study, most of the patients included had renal impairment and the simulations were restricted at a Clcr of up to 59 mL/min. This may limit the generalizability of the findings to patients with similar patient characteristics as in this study, and not those with normal renal function or patients with augmented renal clearance such as patients in intensive care units where vancomycin is commonly used. Additionally, the current study involved a small sample of patients. This may also affect the generalizability of the results in the population under investigation. Future studies with large sample sizes and more comprehensive patient data are recommended to further investigate the outcomes.
Conclusion
A population PK model of vancomycin was developed using data obtained from adult Sudanese patients. The influence of CLcr on vancomycin CL was quantified to help vancomycin dose individualization. Model-based optimized doses achieve comparable outcomes reported in literature and can aid clinicians in selecting initial vancomycin doses that will maximize the rate of response with potentially safe plasma concentrations, considering the patient’s CLcr and the susceptibility of Staphylococcus aureus.
Data Sharing Statement
The data collected as part of this study are available upon reasonable request from the corresponding author.
Acknowledgments
The authors would like to thank Aliaa Specialist Hospital Administration for approving the study and facilitating access to the data. The authors are also very grateful to Lixoft for providing a free license for academic usage.
Author Contributions
All authors made substantial contributions to the research project, whether that is in the conceptualization, study design, execution, acquisition of data, analysis and interpretation, or in all these areas; have drafted, significantly revised, or critically reviewed the manuscript; gave final approval of the version to be published; have agreed on the journal to which the manuscript has been submitted; and have agreed to be accountable for all aspects of the work reported.
Funding
This research was supported by Princess Nourah bint Abdulrahman University Researchers Supporting Project number (PNURSP2023R144), Princess Nourah bint Abdulrahman University, Riyadh, Saudi Arabia.
Disclosure
Unrelated to this work, DG receives research support from Nabriva Therapeutics through a contract with the University of North Carolina at Chapel Hill. The other authors have no relevant conflicts of interest to disclose.
References
1. Choo EJ, Chambers HF. Treatment of methicillin-resistant staphylococcus aureus bacteremia. Infect Chemother. 2016;48(4):267–273. doi:10.3947/ic.2016.48.4.267
2. Rybak MJ, Le J, Lodise TP, et al. Therapeutic monitoring of vancomycin for serious methicillin-resistant Staphylococcus aureus infections: a revised consensus guideline and review by the American society of health-system pharmacists, the infectious diseases society of America, the pediatric infectious diseases society, and the society of infectious diseases pharmacists. Am J Health Syst Pharm. 2020;77(11):835–864. doi:10.1093/ajhp/zxaa036
3. Yan X, Tao X, He L, Cui Z, Zhang J. Increasing resistance in multiresistant methicillin-resistant Staphylococcus aureus clones isolated from a Chinese hospital over a 5-year period. Microb Drug Resist. 2011;17(2):235–239. doi:10.1089/mdr.2010.0029
4. Marlowe KF, Chicella MF, Claridge TE, Pittman SW. An assessment of vancomycin pharmacokinetic variability in pediatric cardiology patients. J Pediatr Pharmacol Ther. 2003;8(2):132–136. doi:10.5863/1551-6776-8.2.132
5. Revilla N, Martín-Suárez A, Pérez MP, González FM, Fernández de Gatta Mdel M. Vancomycin dosing assessment in intensive care unit patients based on a population pharmacokinetic/pharmacodynamic simulation. Br J Clin Pharmacol. 2010;70(2):201–212. doi:10.1111/j.1365-2125.2010.03679.x
6. Stockmann C, Hersh AL, Roberts JK, et al. Predictive performance of a vancomycin population pharmacokinetic model in neonates. Infect Dis Ther. 2015;4(2):187–198. doi:10.1007/s40121-015-0067-9
7. Aljutayli A, Marsot A, Nekka F. An update on population pharmacokinetic analyses of vancomycin, part I: in adults. Clin Pharmacokinet. 2020;59(6):671–698. doi:10.1007/s40262-020-00866-2
8. Bosso JA, Nappi J, Rudisill C, et al. Relationship between vancomycin trough concentrations and nephrotoxicity: a prospective multicenter trial. Antimicrob Agents Chemother. 2011;55(12):5475–5479. doi:10.1128/aac.00168-11
9. Kim JY, Yee J, Yoon HY, Han JM, Gwak HS. Risk factors for vancomycin-associated acute kidney injury: a systematic review and meta-analysis. Br J Clin Pharmacol. 2022;88:3977–3989. doi:10.1111/bcp.15429
10. Sharma M, Braekevelt K, Kale-Pradhan P, Szpunar S, Khatib R. Are blacks at higher risk for vancomycin-related acute kidney injury? J Pharm Pract. 2020;33(5):592–597. doi:10.1177/0897190018800093
11. Olafuyi O, Parekh N, Wright J, Koenig J. Inter‐ethnic differences in pharmacokinetics—is there more that unites than divides? Pharmacol Res Perspect. 2021;9(6):e00890. doi:10.1002/prp2.890
12. Zaric RZ, Milovanovic J, Rosic N, et al. Pharmacokinetics of vancomycin in patients with different renal function levels. Open Med. 2018;13:512–519. doi:10.1515/med-2018-0068
13. Bjornsson TD. Use of serum creatinine concentrations to determine renal function. Clin Pharmacokinet. 1979;4(3):200–222. doi:10.2165/00003088-197904030-00003
14. Schobben F, van der Kleijn E. Drug determinations in body fluids by the enzyme multiplied immunoassay technique (EMIT®). Eur J Drug Metab Pharmacokinet. 1977;2(4):185–189. doi:10.1007/BF03189304
15. Brendel K, Dartois C, Comets E, et al. Are population pharmacokinetic and/or pharmacodynamic models adequately evaluated? A survey of the literature from 2002 to 2004. Clin Pharmacokinet. 2007;46(3):221–234. doi:10.2165/00003088-200746030-00003
16. United States Food and Drug Administration. Department of Health and Human Services. Center for drug evaluation and research. Population pharmacokinetics: guidance for industry. Available from: https://www.fda.gov/media/71364/download.
17. Chu Y, Luo Y, Ji S, Jiang M, Zhou B. Population pharmacokinetics of vancomycin in Chinese patients with augmented renal clearance. J Infect Public Health. 2019;13(1):68–74. doi:10.1016/j.jiph.2019.06.016
18. Jing L, Liu -T-T, Guo Q, Chen M, Lu -J-J, C-l L. Development and comparison of population pharmacokinetic models of vancomycin in neurosurgical patients based on two different renal function markers. JJ Clin Pharm Ther. 2019;45(1):88–96. doi:10.1111/jcpt.13029
19. Kovacevic T, Miljkovic B, Kovacevic P, et al. Population pharmacokinetic model of Vancomycin based on therapeutic drug monitoring data in critically ill septic patients. J Crit Care. 2020;55:116–121. doi:10.1016/j.jcrc.2019.10.012
20. Liu TT, Pang HM, Jing L, et al. A population pharmacokinetic model of vancomycin for dose individualization based on serum cystatin C as a marker of renal function. J Pharm Pharmacol. 2019;71(6):945–955. doi:10.1111/jphp.13071
21. J-J L, Chen M, C-L L, et al. A population pharmacokinetics model for vancomycin dosage optimization based on serum cystatin C. Eur J Drug Metab Pharmacokinet. 2020;45(4):535–546. doi:10.1007/s13318-020-00621-9
22. Ma KF, Liu YX, Jiao Z, et al. Population pharmacokinetics of vancomycin in kidney transplant recipients: model building and parameter optimization. Front Pharmacol. 2020;11:563967. doi:10.3389/fphar.2020.563967
23. Kim DJ, Lee DH, Ahn S, et al. A new population pharmacokinetic model for vancomycin in patients with variable renal function: therapeutic drug monitoring based on extended covariate model using CKD-EPI estimation. J Clin Pharm Ther. 2019;44(5):750–759. doi:10.1111/jcpt.12995
24. Yasuhara M, Iga T, Zenda H, et al. Population pharmacokinetics of vancomycin in Japanese adult patients. Ther Drug Monit. 1998;20(2):139–148. doi:10.1097/00007691-199804000-00003
25. Chung J-Y, Jin S-J, Yoon J-H, Song Y-G. Serum cystatin C is a major predictor of vancomycin clearance in a population pharmacokinetic analysis of patients with normal serum creatinine concentrations. J Korean Med Sci. 2013;28(1):48–54. doi:10.3346/jkms.2013.28.1.48
26. Leroux S, Biran V, van den Anker J, et al. Serum creatinine and serum cystatin c are both relevant renal markers to estimate vancomycin clearance in critically ill neonates. Front Pharmacol. 2021;12:634686. doi:10.3389/fphar.2021.634686
27. Mangin O, Urien S, Mainardi JL, Fagon JY, Faisy C. Vancomycin pharmacokinetic and pharmacodynamic models for critically ill patients with post-sternotomy mediastinitis. Clin Pharmacokinet. 2014;53(9):849–861. doi:10.1007/s40262-014-0164-z
28. Alqahtani SA, Alsultan AS, Alqattan HM, Eldemerdash A, Albacker TB. Population pharmacokinetic model for vancomycin used in open heart surgery: model-based evaluation of standard dosing regimens. Antimicrob Agents Chemother. 2018;62:7.
29. Jalusic KO, Hempel G, Arnemann PH, et al. Population pharmacokinetics of vancomycin in patients with external ventricular drain-associated ventriculitis. Br J Clin Pharmacol. 2021;87(6):2502–2510. doi:10.1111/bcp.14657
30. Okada A, Kariya M, Irie K, et al. Population pharmacokinetics of vancomycin in patients undergoing allogeneic hematopoietic stem-cell transplantation. J Clin Pharmacol. 2018;58(9):1140–1149. doi:10.1002/jcph.1106
31. Vu DH, Nguyen DA, Delattre IK, et al. Determination of optimal loading and maintenance doses for continuous infusion of vancomycin in critically ill patients: population pharmacokinetic modelling and simulations for improved dosing schemes. Int J Antimicrob Agents. 2019;54(6):702–708. doi:10.1016/j.ijantimicag.2019.09.018
32. Garreau R, Falquet B, Mioux L, et al. Population pharmacokinetics and dosing simulation of vancomycin administered by continuous injection in critically ill patient. Antibiotics. 2021;10(10). doi:10.3390/antibiotics10101228
 © 2024 The Author(s). This work is published and licensed by Dove Medical Press Limited. The full terms of this license are available at https://www.dovepress.com/terms.php and incorporate the Creative Commons Attribution - Non Commercial (unported, v3.0) License.
By accessing the work you hereby accept the Terms. Non-commercial uses of the work are permitted without any further permission from Dove Medical Press Limited, provided the work is properly attributed. For permission for commercial use of this work, please see paragraphs 4.2 and 5 of our Terms.
© 2024 The Author(s). This work is published and licensed by Dove Medical Press Limited. The full terms of this license are available at https://www.dovepress.com/terms.php and incorporate the Creative Commons Attribution - Non Commercial (unported, v3.0) License.
By accessing the work you hereby accept the Terms. Non-commercial uses of the work are permitted without any further permission from Dove Medical Press Limited, provided the work is properly attributed. For permission for commercial use of this work, please see paragraphs 4.2 and 5 of our Terms.