")
Back to Journals » Diabetes, Metabolic Syndrome and Obesity » Volume 16
Prevalence of Type 2 Diabetes in Mongolia: Results from Population-Based Survey Compared with 1999 Study
Authors Dayan A, Erkhembayar R, Luvsandavaajav O, Mukhtar Y , Enkhtuvshin B, Tumenbayar B
Received 20 March 2023
Accepted for publication 14 June 2023
Published 21 June 2023 Volume 2023:16 Pages 1833—1846
DOI https://doi.org/10.2147/DMSO.S413320
Checked for plagiarism Yes
Review by Single anonymous peer review
Peer reviewer comments 3
Editor who approved publication: Prof. Dr. Antonio Brunetti
Angarmurun Dayan,1,* Ryenchindorj Erkhembayar,2 Oyunbileg Luvsandavaajav,3 Yerkyebulan Mukhtar,1 Bolormaa Enkhtuvshin,4 Bayasgalan Tumenbayar5,*
1Department of Epidemiology and Biostatistics, School of Public Health, Mongolian National University of Medical Sciences, Ulaanbaatar, Mongolia; 2Department of International Cyber Education, Graduate School, Mongolian National University of Medical Sciences, Ulaanbaatar, Mongolia; 3Center for Health Development, Ulaanbaatar, Mongolia; 4Intermed Hospital, Ulaanbaatar, Mongolia; 5Postgraduate Training Institute, Mongolian National University of Medical Sciences, Ulaanbaatar, Mongolia
*These authors contributed equally to this work
Correspondence: Bayasgalan Tumenbayar, Postgraduate Training Institute, Mongolian National University of Medical Sciences, S.Zorig Street, Sukhbaatar District, 1st Khoroo, Ulaanbaatar, 14210, Mongolia, Tel +976 96664800, Email [email protected]
Purpose: The burden of diabetes in Mongolia has risen tremendously over the last three decades, and an individually tracked, national registry of diabetes is lacking. Therefore, we aim to investigate diabetes prevalence in Mongolia and analyze some associated factors.
Materials and Methods: A cross-sectional, nationally representative, population-based survey was carried out in Mongolia. We recruited participants from randomly selected six different clusters for the required 3113 ± 311 sample size. We collected detailed demographics, diabetes condition and medications, anthropometric measurements, body composition, and glucose profiles. Oral glucose tolerance tests were used to diagnose diabetes using the International Diabetes Federation algorithm. Chi-square and multinomial logistic regression tests were used to determine associated factors. Age-standardized prevalence rates were estimated.
Results: We recruited 3272 participants in the study between June and October 2019. Crude prevalence rates for prediabetes and diabetes were 10.8% (95% CI; 9.8– 11.9) and 11.2% (95% CI; 10.1– 12.3), respectively. Sixty-one adults were newly diagnosed with diabetes. Age-standardized prediabetes and diabetes prevalence rates were 9.8% (95% CI; 8.5– 11.1) and 10.0% (95% CI; 8.7– 11.3) among adults 30 or older. Higher BMI, central obesity, diabetes inheritance, sedentary habitus, and hypertension are significantly associated with diabetes in adjusted analysis for sex and age group.
Conclusion: The prevalence of diabetes has increased at least threefold since 1999 in Mongolia. In addition, numerous modifiable risk factors were associated with diabetes. Therefore, future investigations and programs should focus on combating obesity and sedentary lifestyles and propose dietary recommendations in the context of expanding diabetes in Mongolia.
Keywords: Mongolia, diabetes mellitus, prevalence, cross-sectional studies, glucose intolerance
Introduction
Diabetes prevalence is on the rise globally, and the International Diabetes Federation estimates show the highest potential increase among middle-income countries by 2045.1 Among the world’s regions, the Western Pacific Region is home to 1.9 billion inhabitants and has the third-highest prevalence in the world.1,2
Mongolia is a lower-middle-income, northeastern Asian nation with population 3.3 million people. Over the past three decades, Mongolia has experienced tremendous changes.3 Since 1990, the burden of diseases has shifted predominantly into non-communicable diseases (NCDs) and injuries.3 Suvd et al4 conducted a national diabetes prevalence survey in 1999 as a baseline, showing 3.1% age-standardized rates among adults aged 35 or above using an oral glucose tolerance test (OGTT). Although the STEPS Survey on the Prevalence of Noncommunicable Disease and Injury Risk Factors has been conducted since 2006 at a five-year interval, only fasting blood glucose measurements were used.5 OGTT is preferred over fasting plasma glucose for diabetes prevalence studies, due to several factors including higher sensitivity, higher efficiency in detecting early diabetes, detecting postprandial glucose metabolism alteration that are often overlooked among elderly, and more.6
In Mongolia, the prevalence of diabetes is on the rise, and the latest STEPS survey of 2019 showed a prevalence rate of 8.3% among the population aged 15–69.7 While lacking the confirmatory OGTT, STEPS 2019 study reported overall NCDs risk factors but not for diabetes.7 Currently, sufficient diabetes control and individual-based registry systems are lacking in Mongolia.8 These suggest that diabetes prevalence study was strongly needed for Mongolian population.
Therefore, we aim to investigate diabetes prevalence with confirmatory OGTT in Mongolia and to provide updates on risk factors associated with diabetes.
Materials and Methods
Study Design and Study Population
We designed a national, population-based, point prevalence study. Mongolia is divided into 21 provinces, and the capital, Ulaanbaatar city, forms its five economic regions, including Western, Khangai, Central, Ulaanbaatar, and Eastern regions. Same location sites were chosen intentionally similar to Suvd et al4 investigations from 1999 to provide geographical comparison. These include Khovd (Western), Arkhangai (Khangai), Umnugovi (Central), Dornod (Eastern) provinces, and Songinokhairkhan and Bayanzurkh districts of Ulaanbaatar city. These six cluster sites were chosen to represent geolocational and population characteristics, and direct comparison to the 20 years past of Mongolia with previous investigation of Suvd et al.4
Within the urban clusters, the khoroo, a primary administrative unit of the Ulaanbaatar city, was randomly chosen from Songinokhairkhan and Bayanzurkh districts. Forrural data collection, provincial centers (named soums) were recruited.
Permanent residents of these cluster sites were invited through their local primary health-care centers using household registrations with a sample size of 90–95 participants. Additionally, some (n=17; 0.52%) adults aged 22 and 29 were considered eligible at specific clusters where the target sample was not fulfilled. Participants diagnosed with type 1 diabetes, gestational diabetes, and secondary hyperglycemic conditions were excluded. Participants who had not fasted prior 8 hr were asked to visit the following day for enrollment.
Sampling Methods
We used a systematic random sampling method for every third or fifth household of the local household registries at the primary health-care center. From the households, adults aged 30 or older and permanent resident of the khoroo or soums were invited. An individual from the household was invited to participate and instructed to fast for at least 8 hr before visiting the following day. Non-responders, no show-ups, sick and people who could not attend were documented and next available residents were invited.
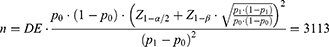
The sample size was determined for an expected 8% (P1) prevalence rate (STEPS 2019 statistics)7 and previously observed 6% baseline (P0) for 95% confidence level and 90% power for 1,512,000 population size aged 30–70 as of 2019. We set the design effect (DE) at 2 for sample size calculation. Therefore, a sample size of 3113 increased by 10% for losses, and missing data were aimed at recruitment, totaling 3424 participants. This sample size was allocated into the six clusters equally to recruit balanced participants for age group and sex and geographically representative.
Data Collection
Trained study staff comprised resident physicians, graduate students, researchers, and local health-care workers conducted the data collection process. Participants were interviewed and measured for detailed demographics, medications history, anthropometric measurements, and blood glucose levels.
We followed the International Diabetes Federation-2017 recommendations for diagnosing DMT2 in this study with an oral glucose tolerance test. Fasting plasma glucose levels were just after registration among all participants and followed by an oral glucose tolerance test (OGTT) with 75 g of glucose anhydrate dissolved in 200 mL of water. After drinking the glucose solution, surveys, anthropometry, and risk assessment were taken. After 2 hr, plasma glucose levels were measured. We used CleverChek TD-4116 (TaiDoc Technology Corporation, Taiwan SAR, PRC) glucometer for plasma glucose measurements in mmol/L units. Due to relatively large sample sizes and rural conditions, only plasma glucose levels were measured at the site for accurate measurements of blood glucose levels. Therefore, previously known participants with diabetes, along with individuals who had discomfort, nausea, and vomiting were discontinued from OGTT. Participants who could not continue OGTT were not pursued for retesting to prevent any measurement discrepancies and to prevent discomfort to the participant, and only fasting blood glucose measures were analysed.
A total of 26 item questionnaires were given to survey residential addresses, dates of birth, sex, hypertension history, and medications. Diabetes status and medications, genetic history, alcohol and tobacco usage, physical activities, and pregnancy were also part of the oral questionnaire. Questionnaire items are designed following the publicly available STEPS 2019 study report and annexes in Mongolian.7
We collected body weight, height, waist, and hip circumference measurements for anthropometric measurements (central obesity: >90 cm for men, >80 cm for women). In addition, blood pressures were measured three times, with participants having no exposure to caffeine, physical exertions, and emotional distractions. We used the TANITA® BC-541 (Tanita Corporation, Japan) bioelectrical impedance analysis tool for body composition estimates, including muscle, fat, bone, and water contents.
Study Timeline
We collected the data between June 1, 2019, and October 30, 2019. Rural data collection was conducted in June, July, and August of 2019, whereas urban data collection was continued in June, September, and October 2019.
Definitions/Outcome/Variables
Prediabetes and diabetes were the primary outcome measures in our study. Blood glucose measurements at 2 hr ranging from 7.8 to 11.0 mmol/L were regarded as prediabetes. Participants with 2-hr plasma glucose read ≥11.1 mmol/L on oral glucose tolerance test or participants on glucose lowering medications were defined as diabetes group according to IDF criteria.9 Total of 97 independent variables are included in the dataset.
Data Analysis
We conducted data analysis using IBM® SPSS 25.0® software, creating maps using GeoDa 1.20 software. The Kolmogorov–Smirnov test for normality assessed the distribution of the data. We expressed a 95% confidence interval for percentages, displayed as 95% (lower-upper bounds). The standard deviation of the mean is expressed along with the means of continuous variables. We set the statistical significance level at p<0.05.
Crude prevalence rates are expressed in percentages for prediabetes and diabetes. Age-standardized prevalence rates were estimated using the standard global population. We used the following formula for standardized age rates: di – Number of cases in age group, wi –Person-years at risk, yi –Standard world population for population 30 or older.10

We used a linear regression analysis to determine the linear relationships of continuous variables. One-way ANOVA and linear comparison tests were used to compare means for groups of three or more. Chi-square and Fisher exact tests were used as appropriate for associations with prediabetes or diabetes compared to normoglycemic individuals. This analysis presents associations in chi-square tests as crude Odd’s Ratio (cOR). Furthermore, we used multinomial logistic regression analysis for adjusted Odd’s Ratio (aOR) with age group and sex as covariates. Normoglycemic people were regarded as control group to identify factors associated with prediabetic and diabetic groups for multinomial logistic regression.
Ethics
The protocol for this study has been approved by the Medical Research Ethical Committee at the Ministry of Health, Mongolia, on 5 January 2018 (approval no.: 2018–38), and it conforms to the provisions of the Declaration of Helsinki (as revised in Fortaleza, Brazil, October 2013). All informed consent was obtained from participants in Mongolian language.
Results
We recruited 3272 participants in the study in Mongolia, where 62% of them were from the four rural provinces. The six study cluster representations ranged from 14.2% to 19.3% among the study population, with the highest recruitment in the Songinokhairkhan district of Ulaanbaatar. Among participants, adults aged 50 to 59 had the highest proportion of participants with 33.03%, followed by 40–49 and 60 and above. The female-to-male ratio was 1/0.65 in our study population. The predominant Khalkh Mongolians represented 80.7% of the study participants, followed by other miscellaneous Mongolian ethnicities and minorities (14.9%). Nearly half of the participants had completed high school, while 30.9% of the population had higher education. Full demographic features are available in Table 1. Among participants, 8.3% or 273 individuals did not have 2-hr plasma glucose reads or did not continue OGTT.
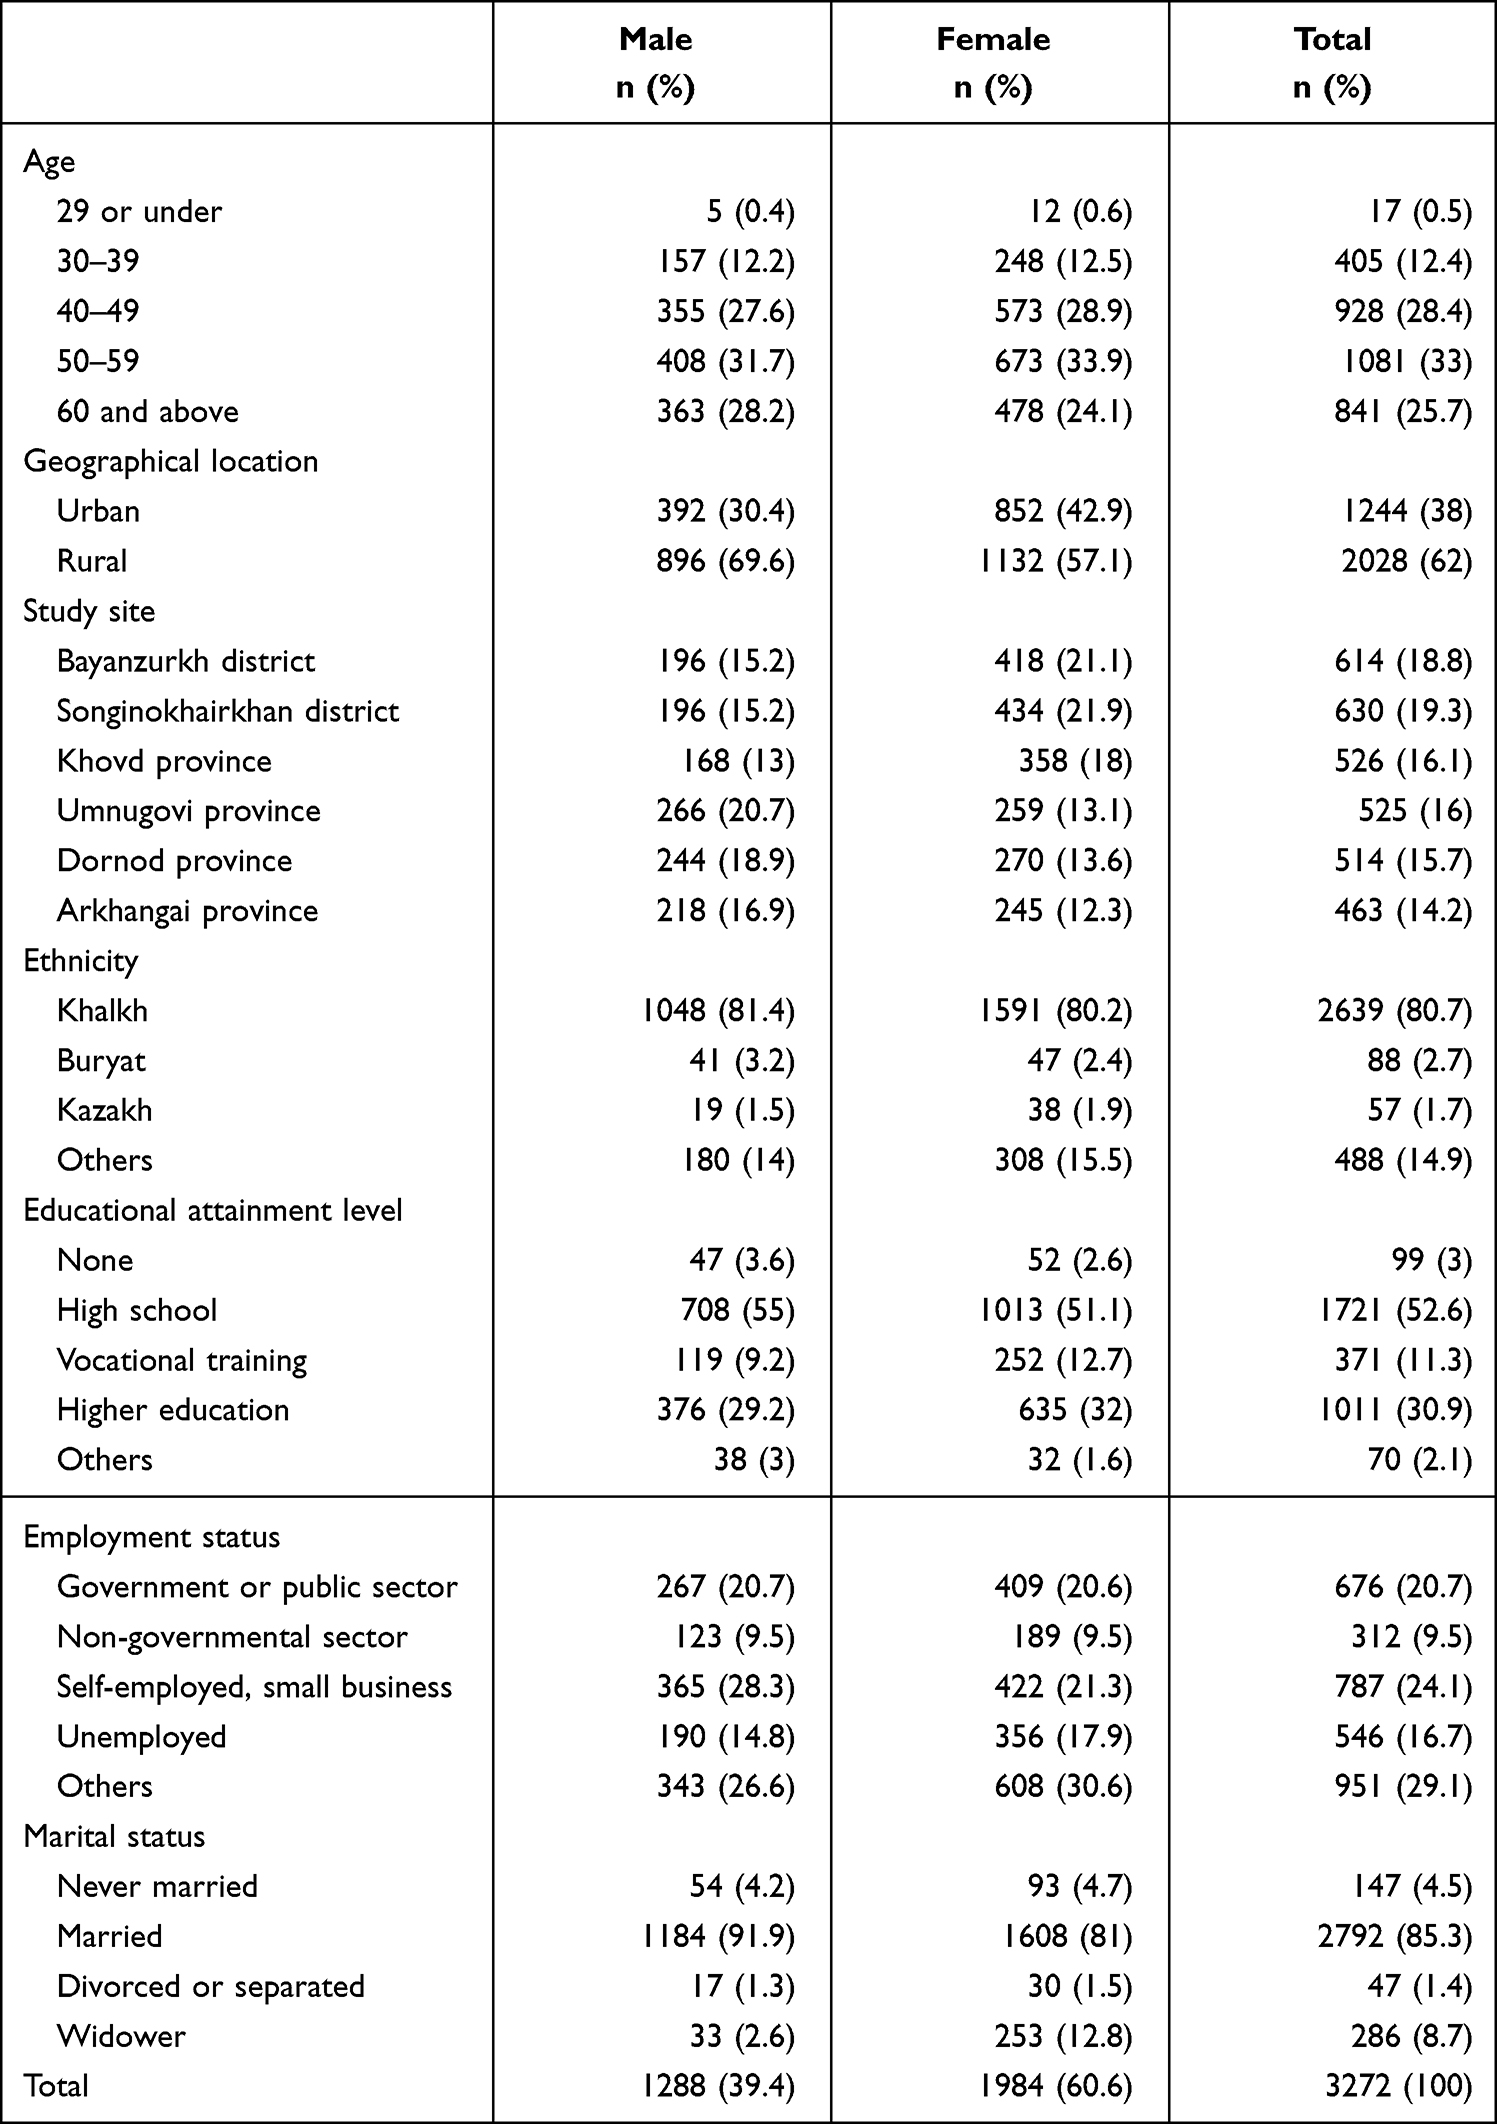 |
Table 1 Sociodemographic Characteristics of Study Participants |
Prediabetes was found in 10.8% of the study population, higher in women (11.9%) than men (9.1%). An estimated age-standardized prevalence of diabetes in Mongolia was 10.2% for men and 9.9% for women, according to the standard world population among populations 30 and above (Table 2). The age-standardized prediabetes prevalence rates were 8.2% for men and 10.8% for women. The overall prevalence of diabetes was 11.2% (95% CI; 10.1–12.3) in our study population (Table 2). Among these, we newly diagnosed 61 (1.9%, 95% CI; (1.4–2.1)) individuals with type 2 diabetes. Diabetes prevalence was slightly higher among males (10.2%) than females (9.9%).
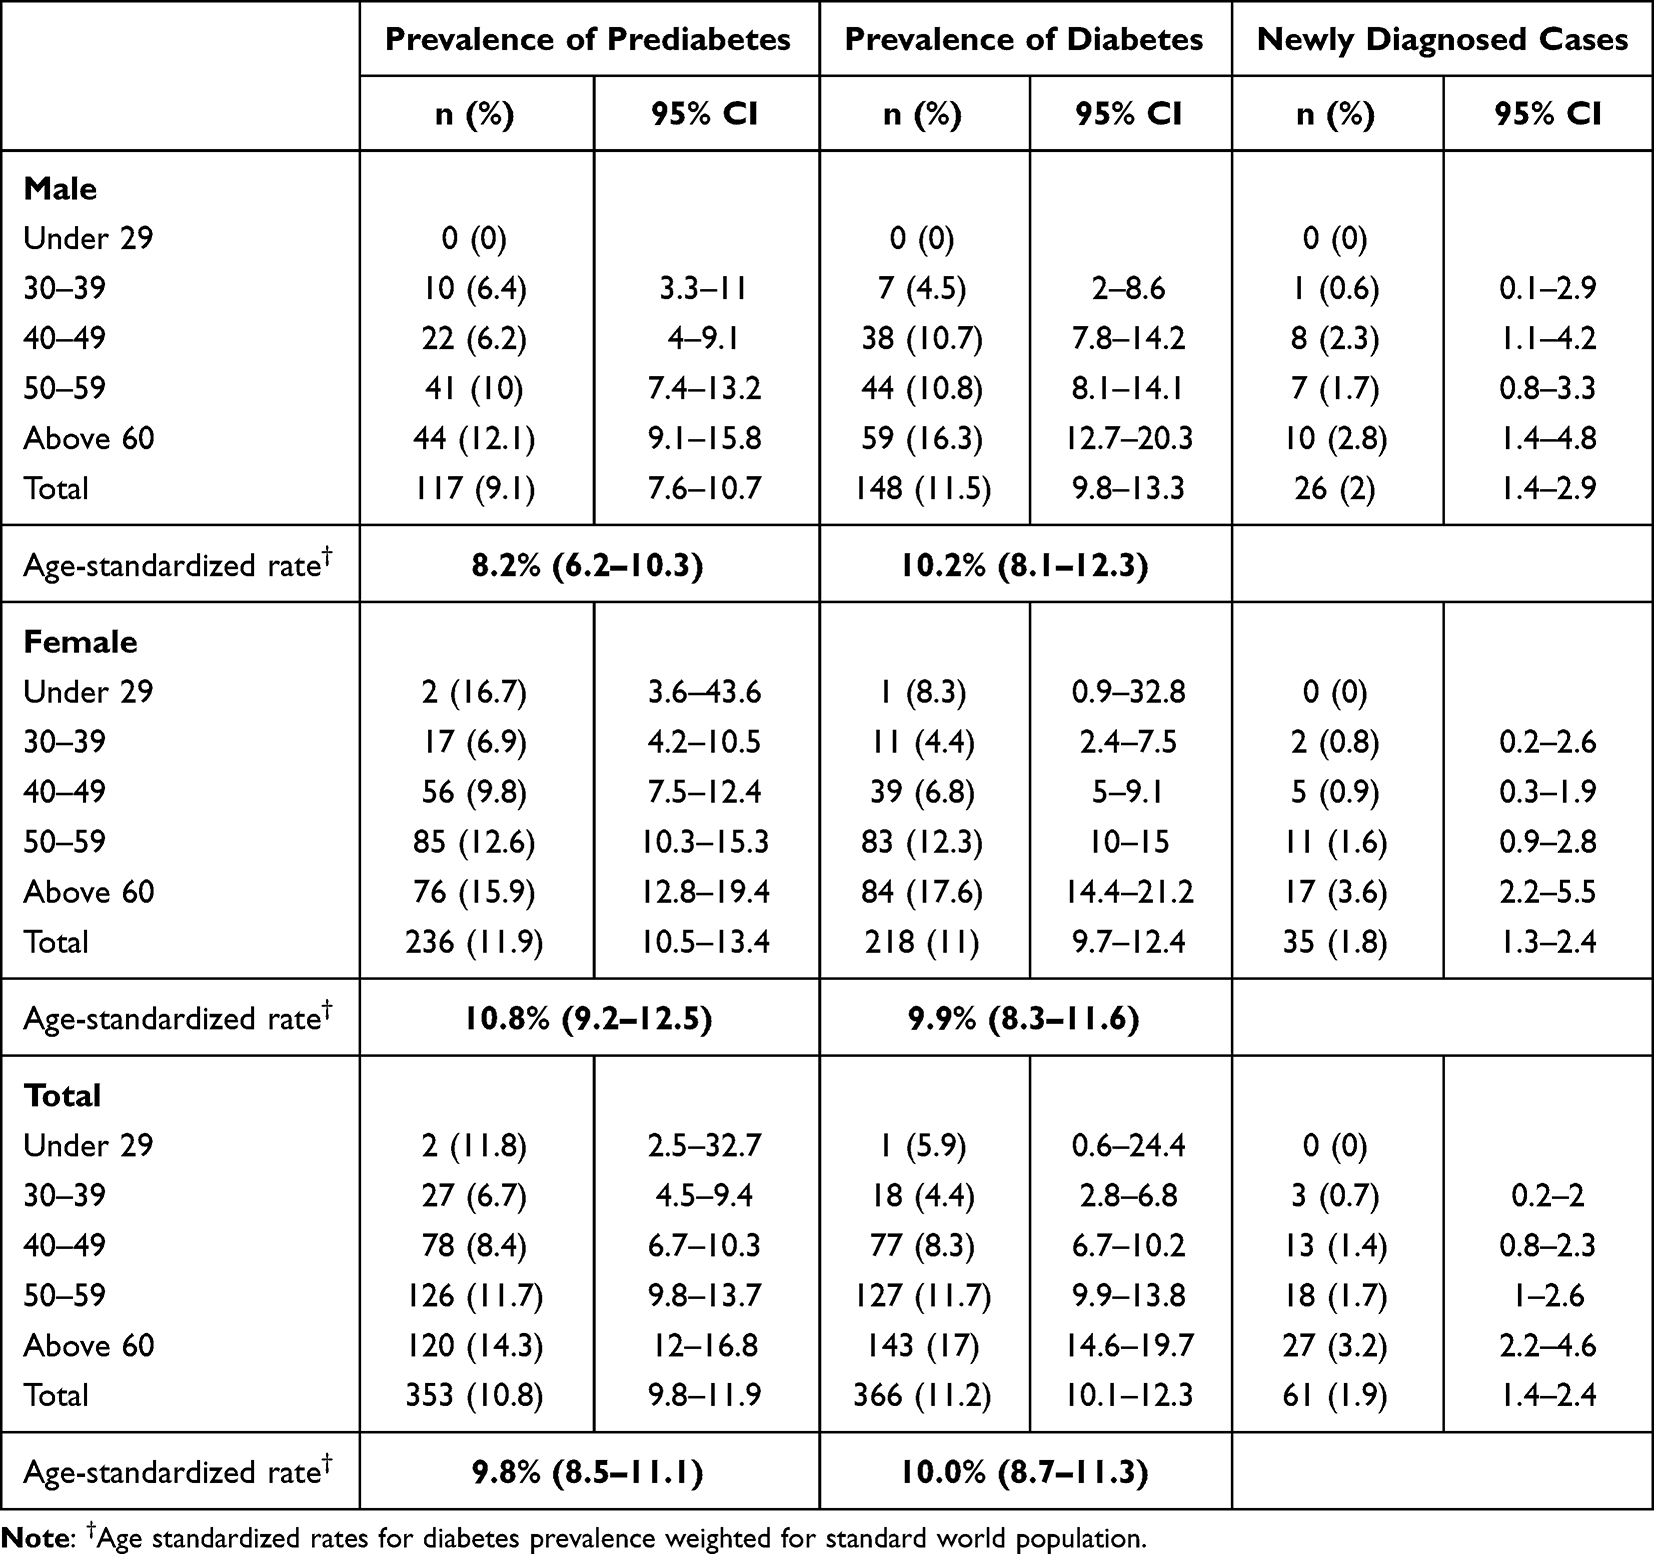 |
Table 2 Diabetes Prevalence Across Age Groups and Age-Standardized Rate in Mongolia, 2019 |
We found no association of dietary factors including fat and salt consumption with diabetes, p>0.05. Furthermore, newly diagnosed diabetes did not differ when compared to previously diagnosed diabetes for sex, age, geolocational status, ethnicity, education, marital status, alcohol consumption, tobacco smoking, occupational factors, and presence of hypertension, p>0.05. However, we observed that dietary oil consumption, central obesity, and salty meal dietary behavior were significantly associated with newly diagnosed diabetes. Participants with newly diagnosed diabetes had salty meal diets more frequently than the previously diagnosed participants (fisher’s exact test, p=0.007). In addition, the central obesity rate was lower, and oil consumption was higher in the newly diagnosed population compared to previously diagnosed group, 78.7% and 88.5%, p=0.038, and 98.4% and 88.9%, p=0.021, respectively. On the other hand, among previously diagnosed population, only 54% (n=164) answered that they take glucose lowering medications.
Figure 1 illustrates the geographical distribution of prediabetes and diabetes in Mongolia. Prediabetes prevalence was highest in the Umnugovi province, followed by Ulaanbaatar city and Dornod province. Concurrently, diabetes prevalence was highest in Khovd province with 14.3% and lowest in Arkhangai province. Diabetes prevalence was higher in urban areas at 12.8%, in contrast to the 10.2% prevalence rate in rural areas. Similarly, prediabetes was higher in Ulaanbaatar city (11.7%) than in the provinces (10.3%). Overall, the urban population had significantly higher diabetes and prediabetes prevalence rates compared with the rural population (chi-square test, p=0.023).
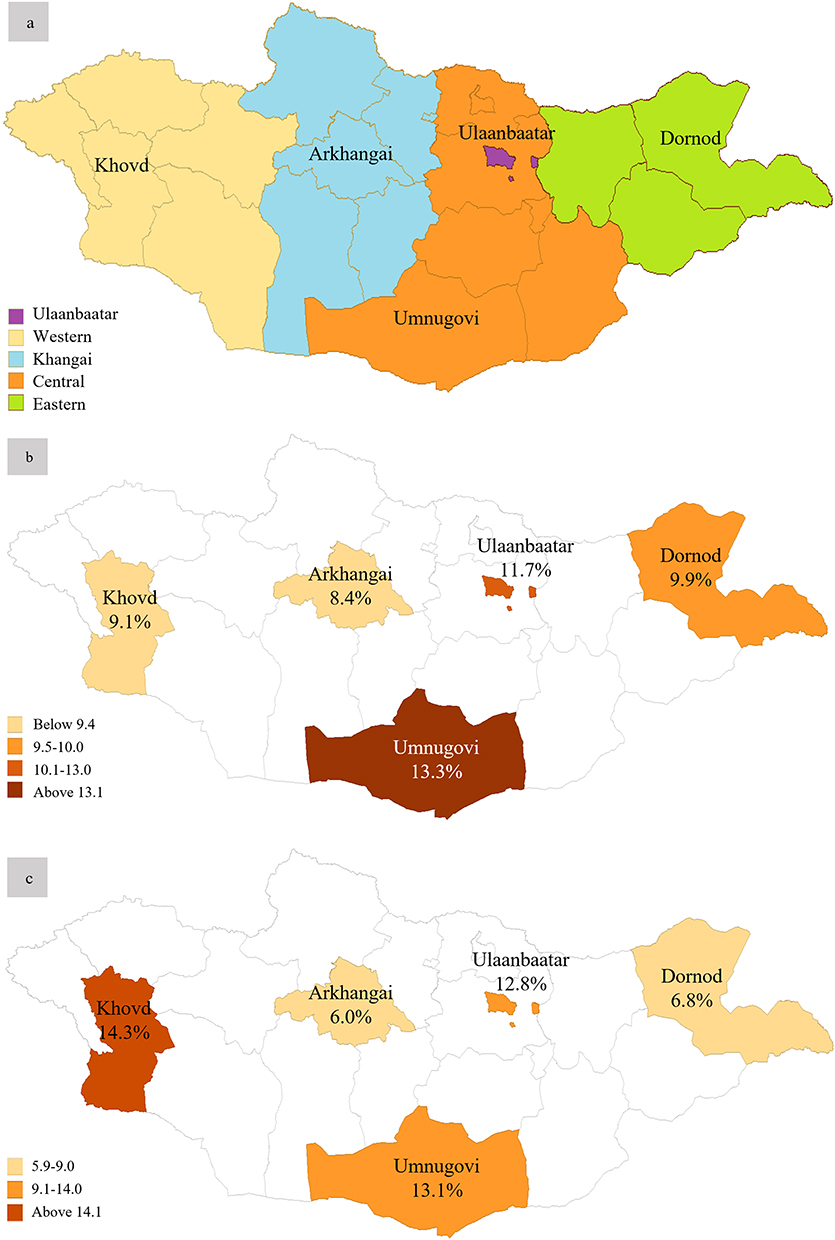 |
Figure 1 Geographical variation of prediabetes and diabetes prevalence in Mongolia, 2019; (a) the study clusters and regions of Mongolia. (b) Prediabetes prevalence. (c) Diabetes prevalence. |
The highest prevalence of diabetes in both sexes was in the eldest age group, adults above 60. There were noticeable gaps between men and women in 40–49 and 50–59. Men aged 40–49 had a 3.9% higher prevalence of diabetes than their female counterparts, while women had a 1.5% higher prevalence in 50–59 years. Table 2 and Figure 2 illustrate Mongolia’s sex-specific and overall prevalence rates. For men and women, the prevalence rates for prediabetes and diabetes were significantly different among age groups in the test of independence analysis, excluding the 29 or under subgroups, χ2=28.102, p<0.001, and χ2=67.574, p<0.001, respectively (χ2- test statistics for chi-square test). Interestingly, younger males aged 30–39 (6.4%) had slightly higher prediabetes than males aged 40–49 (6.2%), while females had an increasing pattern along with age, Table 2. Fasting plasma glucose and 2-h plasma glucose tolerance were linearly related to age, β=0.115, p<0.001, and β=0.185, p<0.001, respectively (unstandardized beta coefficient of linear regression).
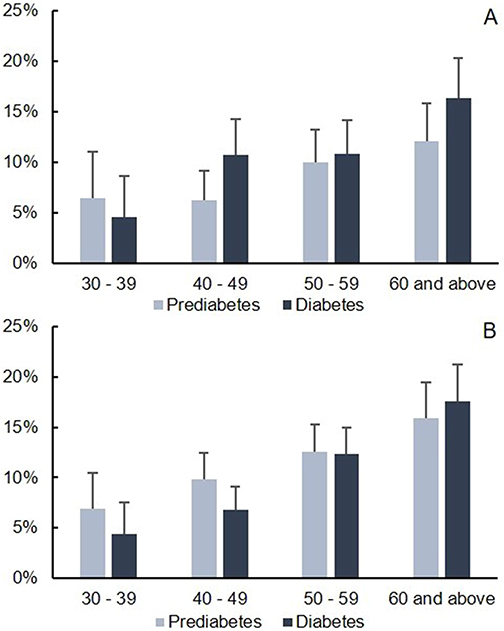 |
Figure 2 Prediabetes and diabetes prevalence across age groups in Mongolia; (A) males, (B) females. |
Among the participants, men and women had anthropometric differences between subgroups of normoglycemic, prediabetes, and diabetes conditions, Table 3. We observed significant differences between groups and stepwise patterns accordingly. Men and women with diabetes who are obese (BMI≥30.0) represented 48.3% and 50.2%, whereas 41.6% and 39.2% were obese among participants with prediabetes, respectively. Among men and women with normal glucose level, 27.1%, and 30.9% were obese. Overall, the study population was 33.1% obese, 39.8% overweight, 26.0% normal weight, and 1.1% underweight according to BMI.
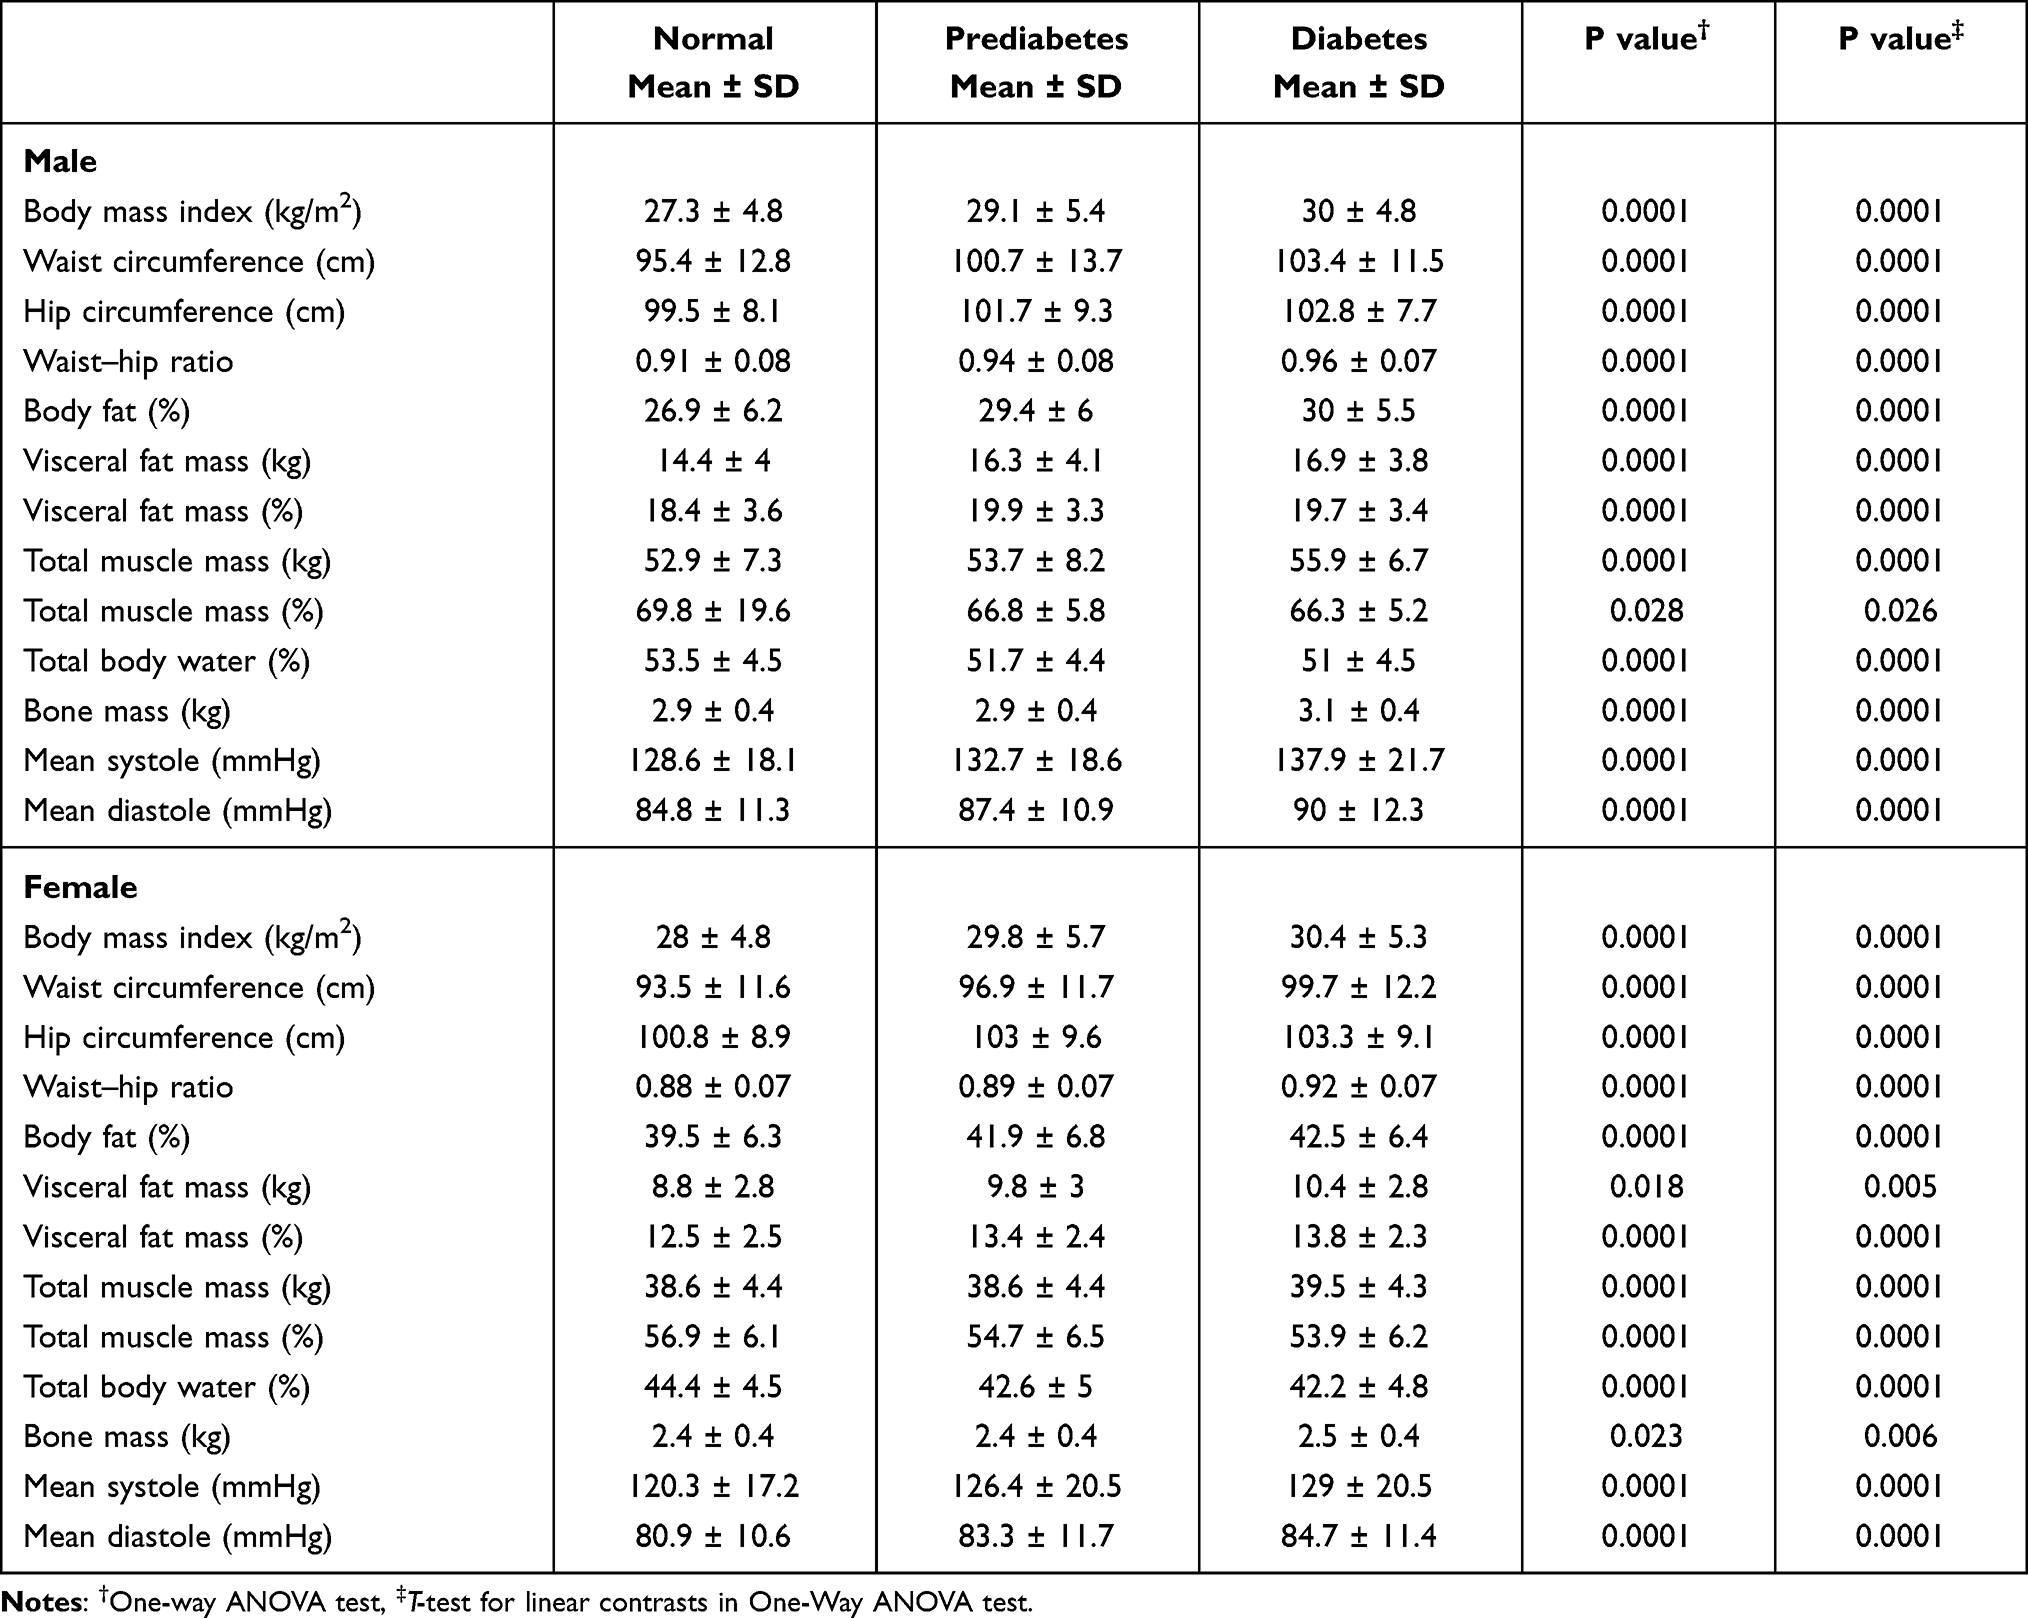 |
Table 3 Anthropometric Profile and Some Body Composition Features Among Normoglycemic, Prediabetic and Diabetic Mongolian Adults |
Table 4 summarizes the factors associated with prediabetes and diabetes in Mongolia. Although living in rural provinces had 0.76 (95% CI; 0.61–0.95) times lower odds of having diabetes, there were no significant associations after controlling for sex and groups.
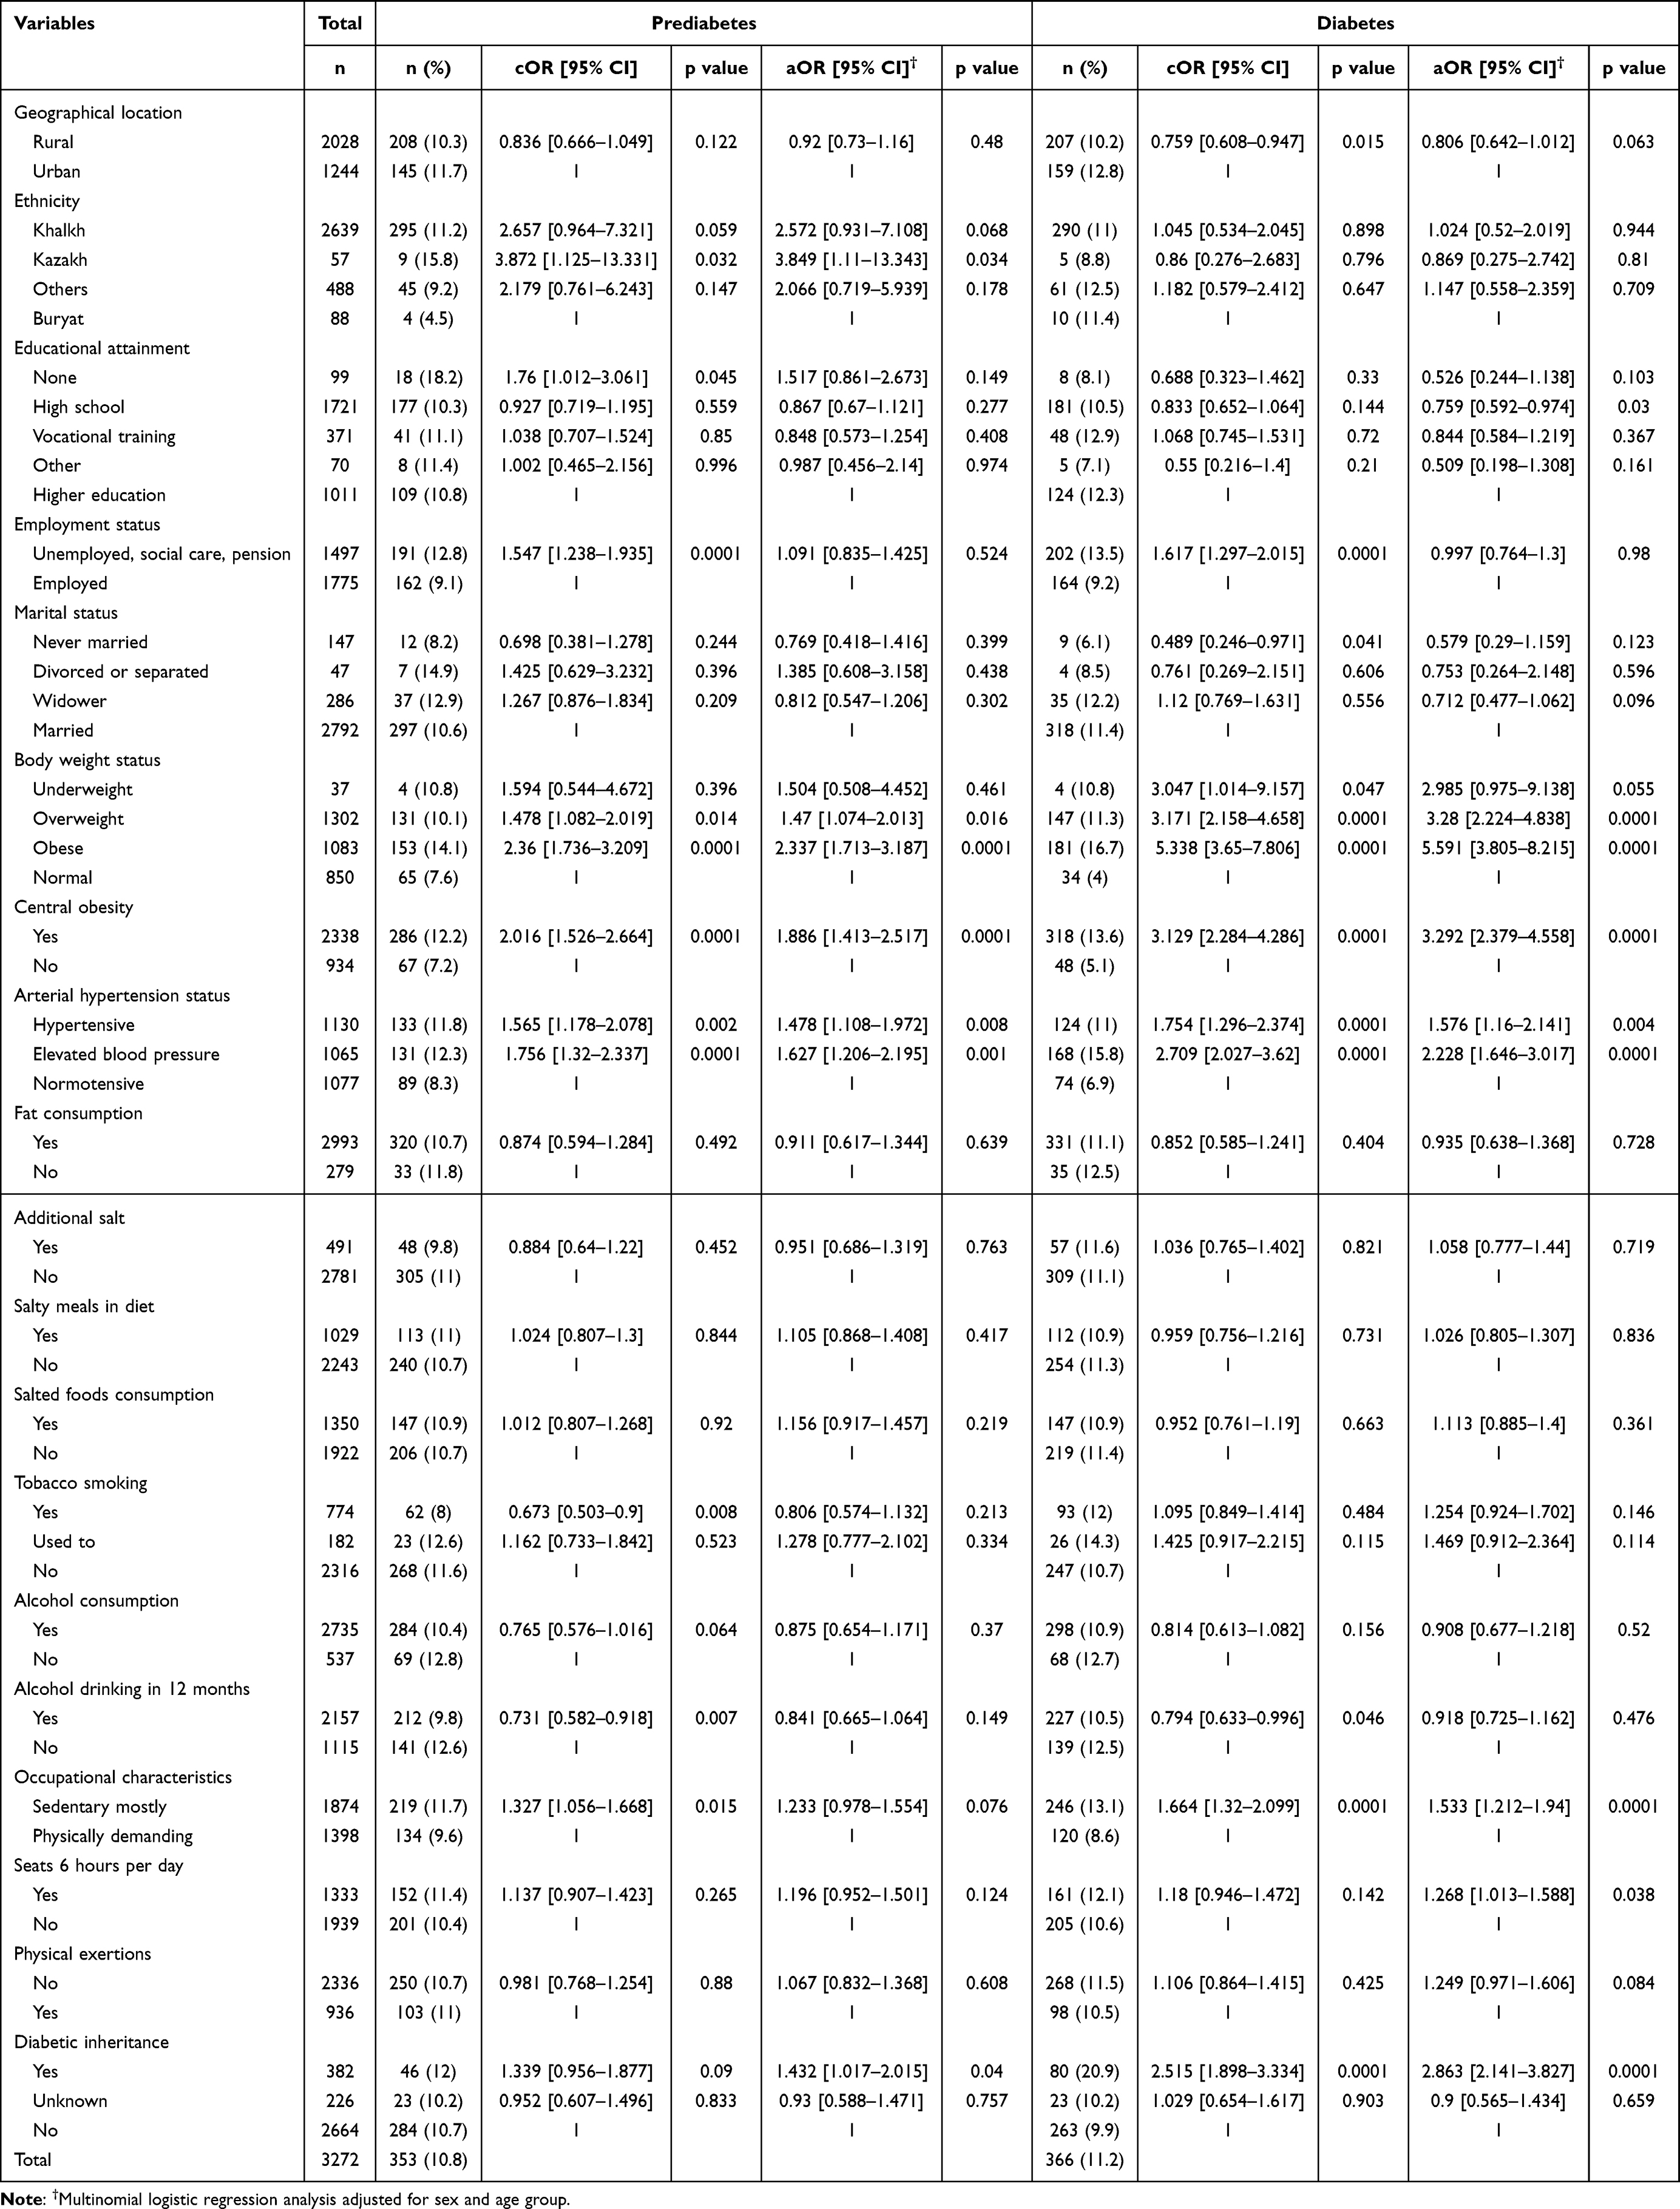 |
Table 4 Factors Associated with Prediabetes and Diabetes in Mongolia, 2019 |
Overweight and obese individuals had significantly higher odds of being prediabetic and diabetic in simple binary and multinomial logistic regressions, supported by central obesity. For example, centrally obese adults had 1.89 (95% CI; 1.41–2.52) and 3.29 (95% CI; 2.4–4.59) times higher odds for having prediabetes and diabetes in adjusted analysis for sex age groups.
Pre-hypertension and hypertension were significantly more prevalent in the prediabetic and diabetic populations compared to normoglycemic populations. The diabetic population had 1.58 (95% CI; 1.16–2.14) times more hypertensive individuals and 2.23 (95% CI; 1.65–3.02) times higher elevated arterial blood pressures than the non-diabetics, respectively.
We did not observe associations between dietary factors, including salt and oil consumption, with diabetes. However, smoking, alcohol consumption, and sedentary work were associated with prediabetes; however, no differences were observed after adjusting for age and sex. Diabetic individuals had 1.53 (95% CI; 1.21–1.94) times higher sedentary works in an adjusted analysis. Sitting for more than 6 hr per day was also associated with diabetes; aOR=1.268, p=0.038. Family history of diabetes was associated with both unadjusted and adjusted analyses, aOR=1.43 (95% CI; 1.02–2.02) and aOR=2.86 (2.14–3.83) for prediabetes and diabetes, respectively.
Discussion
We found diabetes to be one in 10 among Mongolians aged 30 and above as of mid-to-late 2019. Of these, 1.9% of the study population were diagnosed for the first time with type 2 diabetes. Prediabetes was near the diabetes prevalence rate, slightly higher among women divergently from diabetes.
Since 1999, diabetes prevalence has increased 3.2 times in Mongolia over the 20 years. Despite the substantial increase in diabetes prevalence, prediabetes prevalence did not differ from Suvd et al investigation from 1999.4 According to the third and fourth national surveys on the prevalence of non-communicable disease and injury risk factors (STEPS), the diabetes prevalence was at 5.0% (2013)11 and 8.3% (2019)7 among adults aged 25 to 64 and 15 to 69 by fasting blood glucose levels in Mongolia. These indicate that diabetes and other NCDs have been increasing in Mongolia in the last three decades despite the government of Mongolia having a national program to combat the NCDs from 2017.12
Several major systemic factors may have contributed to a substantial increase in diabetes prevalence. Demographic shift was one of the most crucial drivers of diabetes in Mongolia. Over 20 years, the population of Mongolia had grown from 2.44 to 3.22 million,13 and the average life expectancy at birth also increased by 6.1 years, respectively. Due to desertification, climate challenges, and job opportunities, the traditionally nomadic herders migrated to Ulaanbaatar city and provincial centers. In addition, the booming mining industry enabled migration to Umnugovi province, with 43% population growth since the early 2000s.14 Umnugovi province had highest prevalence for prediabetes among the provinces. Moreover, to these demographic shifts, the lifestyle has changed considerably more into urban and sedentary lifestyles between 1999 and 2019, as technological advances were introduced in rural areas.15 Economic growth is also another potential major contributor to the increase in diabetes. GDP per capita rose from 474USD to 4405USD between 2000 and 2019.16
Across the provinces and regions of Mongolia, Khovd province had the highest prevalence rate of 14% and Arkhangai province had the lowest (6%). Khovd province and western region are home to multiple Mongolian ethnicities, while Arkhangai province is predominated by homogenous Khalkha Mongolians. Although genetics plays an important role in development of diabetes, we found no evident determinant leading to differences in diabetes prevalence. Further research is needed for rural Mongolian diabetes epidemiology, in link to herding families, mining workers, and disadvantaged groups.
Diabetes control remains at an unsatisfactory level in Mongolia.8 We found that nearly half of the previously diagnosed diabetic population admitted not receiving any antidiabetic medications in our study. The western pacific region has one of the highest proportions of undiagnosed diabetic people in the world.1 We found 61 new diabetes cases or 1.67 per 10-diabetic population in our survey, where 1 in every two diabetics are undiagnosed in the western pacific region.2 Although our findings suggest a lower undiagnosed diabetic prevalence rate than region, more undiagnosed rates were reported on STEPS 20197 at least for males in Mongolia.
The Western Pacific Region has the third highest diabetes prevalence and second-highest undiagnosed diabetic population in the world.2 Although the prevalence of diabetes in Mongolia is not the highest in the region, the age-adjusted prevalence rate for adults 20–79 years old is somewhat closer to other Asian populations, including South Korea (6.8) and Japan (6.6) according to 2021 IDF diabetes atlas estimations.2
In a recent Chinese national survey, diabetes prevalence was highest in the neighboring Inner Mongolia region among the 31 provinces, with a 19.9% prevalence rate in 2018.17 Mongolian ethnicities comprise nearly 20% of all population in the Inner Mongolia autonomous region of the PRC.18 Family history of diabetes was established as one of the strongest risk factors for diabetes in our survey. These findings support genetically and culturally, Mongolians could be more susceptible to becoming diabetic when coupled with highly prevalent NCDs risk factors.
Obesity is a well-known risk factor for insulin resistance and type 2 diabetes.19 In Mongolia, obesity has become more prevalent over the past three decades.7,11 A systematic analysis of consecutive STEPS surveys from 2005 to 2013 showed a 6.8% and 7.5% increase in obesity among men and women, respectively.20 Although the study age group differed from our investigation, the population became more obese at a significant rate over time in Mongolia. We found an alarmingly large difference in overweight and obesity rates between Suvd et al’s4 1999 diabetes prevalence study and our investigation in 2019; 31.4% and 39.8%, and 20.1% and 33.1%, respectively, for a similar sampling frame. We established obesity according to BMI categories as one of the strongest determinants for diabetes in an adjusted analysis for age and sex. Although a slight decrease is observed in the fourth national STEPS7 survey on overweight and obesity in 2019, obesity remains a major threat to Mongolians’ health. Similarly, central obesity, defined by waist circumference, was a risk factor in the adjusted analysis.
A dietary pattern involving higher contents of red meat and refined grains and lower in fruit and nuts is considered a risk factor for diabetes.21 We have not observed associations between dietary factors and diabetes when surveyed for salt in food, salted products, fat consumption, cooking oil, etc. However, a carefully designed nutritional epidemiological study from Mongolian urban and rural areas indicates diets are high in red meat, refined grains, and whole-fat dairy and low in fruits, eggs, nuts and seeds, and whole grains. Low fruit and vegetable consumption are more frequently reported in western and eastern provinces than in Ulaanbaatar.22 Despite having no association for diabetic status compared to non-diabetics, we found that dietary risk factors were associated with being a newly diagnosed diabetic in comparison to known diabetics in our study.
Among other risk factors for diabetes, we observed that sedentary lifestyles and adults who sat at least 6 hr daily were significantly associated with diabetes in an adjusted analysis for sex and age. Mongolians are traditionally nomadic populations with substantial physical exertions associated with animal husbandry. Findings from unadjusted analysis support that the rural lifestyle is a protective factor for diabetes in Mongolia. Ulaanbaatar is the coldest capital city globally, with an annual average temperature −1°C. However, little has changed over Mongolian red meat-based culinary culture and dietary behavior, while energy expenditure reduced dramatically in Ulaanbaatar compared to living in rural areas. In addition, Ulaanbaatar experiences catastrophic air pollution in cold months due to coal fuel-based domestic heating in the suburbs of the city.23 Long-term exposure to particulate matter 2.5 (PM 2.5) or fine particles associated with diabetes from a meta-analysis of birth cohorts in link to air pollution.24 Finally, elevated blood pressure was significantly associated with diabetes in our survey. In a large-scale study with a racially similar population from South Korea, high blood pressure was significantly associated with the risk of developing diabetes.25
Our study precedes the SARS-CoV-2 emergence, and the pandemic response to COVID-19 may have worsened the well-recognized diabetes risk factors in Mongolia. Following our study, Mongolia maintained stringent control measures for SARS-CoV-2, including stay-at-home orders, school closures, and restrictions on entertainment and non-essential commercial services in most of 2020 and 2021. These ultimately could have reduced physical activity among the population and may have increased NCDs risk factors.26,27 Moreover, essential health services such as diabetes education could have experienced delays and disruptions during 2021 in Mongolia since the country had relatively high rates of COVID-19 related hospitalizations.26 Realizing these challenges and in continuation of the national agenda to combat the NCDs,12 the government of Mongolia is pushing forward to a national early detection and screening campaign in May 2022.28 This campaign should also consider that a hidden 2.9% crude prevalence rate was detected in our survey compared to the fourth national STEPS7 survey of the same year.
We have several limitations in this study. First, more female populations were recruited for this study. However, we applied age group and sex standardizations to multinomial logistic regression analysis to overcome this gap. At the sampling units in provinces, quotas for nomadic herders were not set specifically; thus, we could not analyze occupational risk factors at detailed levels. Despite the tiny number of invitees missed from data collection, we were not able to rule out terminally ill and disabled diabetics in the analysis.
Conclusion
The current study was the only nationally representative survey utilizing the confirmatory OGTT to diagnose diabetes in Mongolia since 1999. We found a 10% diabetes prevalence rate in age-standardized estimation among Mongolians aged 30 or older as of mid-2019. These findings show at least a threefold increase in diabetes prevalence over the last twenty years. Future investigations should discover diabetes control and interventions to reduce NCDs risk factors in both rural and urban settings of Mongolia. Obesity, lack of physical exertions, and high blood pressure were modifiable risk factors for diabetes. Rural nomadic populations should be selectively investigated in further studies to analyze diabetes prevalence and risk factors. Such intervention programs should consider Mongolian-specific recommendations in growing diabetes and other NCDs, where traditional red-meat-based dietary patterns are maintained, the physical exercise environment and seasons are limited.
Acknowledgment
The authors sincerely thank all primary health-care workers for their kind support in this study. Moreover, we thank Dr. William Evans and Merva Crisostomo for English editing, Dr. Batchimeg Batsukh, Dr. Altantsetseg Gantugs, Dr. Lkhagvaa Yadmaa, and Dr. Bumdelger Batbold for their contribution to onsite data collection, and Dr. Dorjbalam Gansukh for his assistance in the creation of tables and figures.
Author Contributions
All authors made a significant contribution to the work reported, whether that is in the conception, study design, execution, acquisition of data, analysis and interpretation, or in all these areas; took part in drafting, revising or critically reviewing the article; gave final approval of the version to be published; have agreed on the journal to which the article has been submitted; and agree to be accountable for all aspects of the work.
Funding
This study was funded by the Mongolian Foundation for Science and Technology under grant #ШУУЗ-2017/03, per request from the Ministry of Health, Mongolia. The funders had no role in study design, data collection and analysis, decision to publish, or preparation of the manuscript.
Disclosure
The authors declare no conflicts of interest in this work.
References
1. Sun H, Saeedi P, Karuranga S, et al. IDF diabetes atlas: global, regional and country-level diabetes prevalence estimates for 2021 and projections for 2045. Diabetes Res Clin Pract. 2022;183:109119. doi:10.1016/j.diabres.2021.109119
2. IDF Diabetes Atlas. Western pacific diabetes report 2000–2045. International Diabetes Federation. Available from: https://diabetesatlas.org/data/en/region/8/wp.html.
3. Chimed-Ochir O, Delgermaa V, Takahashi K, et al. Mongolia health situation: based on the global burden of disease study 2019. BMC Public Health. 2022;22(1):5. doi:10.1186/s12889-021-12070-3
4. Suvd J, Gerel B, Otgooloi H, et al. Glucose intolerance and associated factors in Mongolia: results of a national survey. Diabet Med. 2002;19(6):502–508. doi:10.1046/j.1464-5491.2002.00737.x
5. World Health Organization. Mongolian STEPS Survey on the Prevalence of Noncommunicable Disease Risk Factors 2006. WHO Regional Office for the Western Pacific; 2008.
6. Bartoli E, Fra GP, Carnevale Schianca GP. The oral glucose tolerance test (OGTT) revisited. Eur J Intern Med. 2011;22(1):8–12. doi:10.1016/j.ejim.2010.07.008
7. Fourth national STEPS survey on the prevalence of noncommunicable disease and injury risk factors-2019. Available from: https://online.fliphtml5.com/rhodh/ibek/#p=1.
8. Tumenbayar B. Diabetes control in Mongolia: facts and needs. Cent Asian J Med Sci. 2016;2(2):109–110.
9. Magliano DJ, Boyko EJ. IDF Diabetes Atlas.
10. Bray FI, Ferlay J. Age standardization. IARC Sci Publ. 2014;164:112–115.
11. Third national STEPS survey on the prevalence of noncommunicable disease and injury risk factors-2013. Available from: https://cdn.who.int/media/docs/default-source/ncds/ncd-surveillance/data-reporting/mongolia/steps/mongolia-2013-steps-report.pdf?sfvrsn=d7f4bcfa_3&download=true.
12. Government Resolution. National program on combatting the non-communicable diseases. The Government of Mongolia. Available from: https://legalinfo.mn/mn/detail/12907.
13. National Statistical Office of Mongolia. Population statistics of Mongolia by age group and sex, 2002–2019. Available from: https://1212.mn/tables.aspx?tbl_id=DT_NSO_0300_003V1&SEX_select_all=0&SEXSingleSelect=_1&AGE_GROUP5_select_all=0&AGE_GROUP5SingleSelect=_1&YearY_select_all=0&YearYSingleSelect=_2019_2018_2001_2002_2003_2020&viewtype=table.
14. National Statistical Office of Mongolia. Population of Mongolia by region, province/capital, urban/rural, for Umnugovi province, 2002–2019. Available from: https://1212.mn/tables.aspx?tbl_id=DT_NSO_0300_004V1&RESIDENT_select_all=0&RESIDENTSingleSelect=&SOUM_select_all=0&SOUMSingleSelect=_346&YearY_select_all=1&YearYSingleSelect=&viewtype=table.
15. Dashzeveg D, Nakamura K, Seino K, Al-Sobaihi S, Palam E. Changes in the configuration and patterns of physical activity among Mongolian adults, 2005–2013. J Rural Med. 2018;13(2):151–159. doi:10.2185/jrm.2977
16. The World Bank. GDP per capita (current US$) - Mongolia, world bank national accounts data, and OECD national accounts data files. Available from: https://data.worldbank.org/indicator/NY.GDP.PCAP.CD?locations=MN.
17. Li Y, Teng D, Shi X, et al. Prevalence of diabetes recorded in mainland China using 2018 diagnostic criteria from the American Diabetes Association: national cross sectional study. BMJ. 2020;369:m997. doi:10.1136/bmj.m997
18. China Internet Information Center. Demographic statistics of Inner Mongolia autonomous region. Available from: http://www.china.org.cn/english/features/45688.htm.
19. Arcidiacono B, Chiefari E, Foryst-Ludwig A, et al. Obesity-related hypoxia via miR-128 decreases insulin-receptor expression in human and mouse adipose tissue promoting systemic insulin resistance. EBioMedicine. 2020;59:102912. doi:10.1016/j.ebiom.2020.102912
20. Chimeddamba O, Gearon E, Stevenson C, Liviya Ng W, Baasai B, Peeters A. Trends in adult overweight and obesity prevalence in Mongolia, 2005–2013. Obesity. 2016;24(10):2194–2201. doi:10.1002/oby.21595
21. Ardisson Korat AV, Willett WC, Hu FB. Diet, lifestyle, and genetic risk factors for type 2 diabetes: a review from the Nurses’ health study, nurses’ health study 2, and health professionals’ follow-up study. Curr Nutr Rep. 2014;3(4):345–354. doi:10.1007/s13668-014-0103-5
22. Bromage S, Daria T, Lander RL, et al. Diet and nutrition status of Mongolian adults. Nutrients. 2020;12(5):1514. doi:10.3390/nu12051514
23. Cousins S. Air pollution in Mongolia. Bull World Health Organ. 2019;97(2):79–80. doi:10.2471/BLT.19.020219
24. He D, Wu S, Zhao H, et al. Association between particulate matter 2.5 and diabetes mellitus: a meta-analysis of cohort studies. J Diabetes Investig. 2017;8(5):687–696. doi:10.1111/jdi.12631
25. Kim MJ, Lim NK, Choi SJ, Park HY. Hypertension is an independent risk factor for type 2 diabetes: the Korean genome and epidemiology study. Hypertens Res. 2015;38(11):783–789. doi:10.1038/hr.2015.72
26. Chimeddorj B, Mandakh U, Le LV, et al. SARS-CoV-2 seroprevalence in Mongolia: results from a national population survey. Lancet Reg Health West Pac. 2021;17:100317. doi:10.1016/j.lanwpc.2021.100317
27. Erkhembayar R, Dickinson E, Badarch D, et al. Early policy actions and emergency response to the COVID-19 pandemic in Mongolia: experiences and challenges. Lancet Glob Health. 2020;8(9):e1234–e1241. doi:10.1016/S2214-109X(20)30295-3
28. Cabinet secretariat of Government of Mongolia, press release on national campaign for early detection and screening starting from May 2022. Available from: https://cabinet.gov.mn/6263.html.
 © 2023 The Author(s). This work is published and licensed by Dove Medical Press Limited. The full terms of this license are available at https://www.dovepress.com/terms.php and incorporate the Creative Commons Attribution - Non Commercial (unported, v3.0) License.
By accessing the work you hereby accept the Terms. Non-commercial uses of the work are permitted without any further permission from Dove Medical Press Limited, provided the work is properly attributed. For permission for commercial use of this work, please see paragraphs 4.2 and 5 of our Terms.
© 2023 The Author(s). This work is published and licensed by Dove Medical Press Limited. The full terms of this license are available at https://www.dovepress.com/terms.php and incorporate the Creative Commons Attribution - Non Commercial (unported, v3.0) License.
By accessing the work you hereby accept the Terms. Non-commercial uses of the work are permitted without any further permission from Dove Medical Press Limited, provided the work is properly attributed. For permission for commercial use of this work, please see paragraphs 4.2 and 5 of our Terms.